Massive Logic Speed Increase - Loop Logic Vs. Each Logic

Hey. So, as far as I knew, the BGE was just going to be slow when you were working on scenes featuring a lot of logic (like particles, for example. It was fast enough for one or two particle systems, but running a lot wasn’t too good for the FPS).

But then, I stumbled on an idea that works exceptionally well. Rather than running logic in every object of a type (like a particle, or even an enemy if you have a lot of them), or even reducing the frequency of that script running, it’s better to loop through a list of said objects and run the logic for them. The overhead that the BGE uses associated with each object’s individual script running is apparently high, and taking out this factor decreased logic over 400% for me (from 36% to 8% in one scene). That is unprecedented. In quicker terms, check out the screenshots.

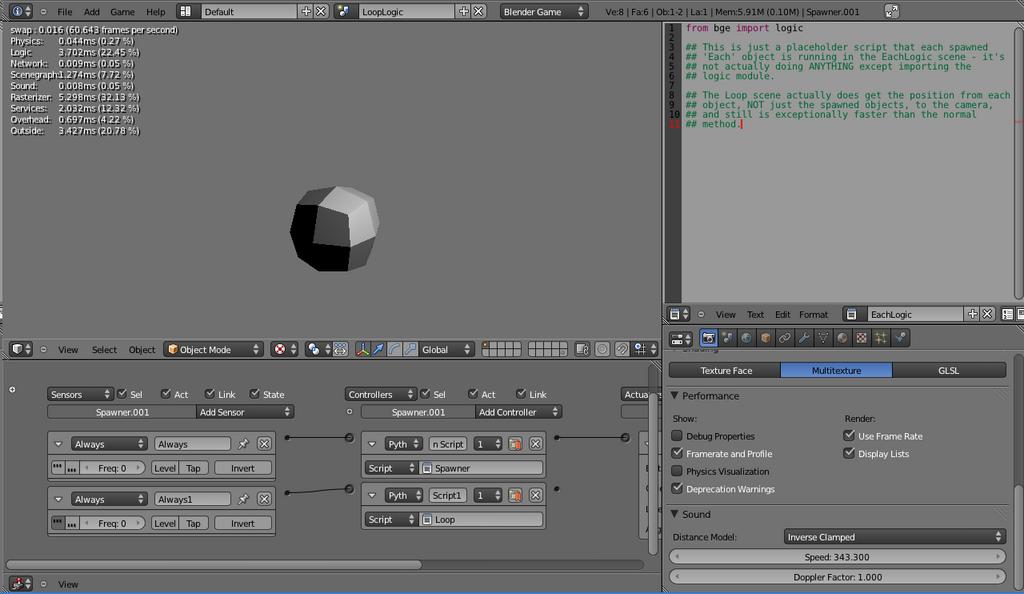
In the two screenshots below this, the one running at 18 FPS shows a normal scene in which I spawned 1000 objects each running a SIMPLE script that just imports the bge.logic module. The second running at 60 FPS shows a scene in which I spawned 1000 objects that don’t run a script, and the spawner object loops through all objects in the scene TWICE to perform a simple calculation on them. Logic is at around 20% this time. Yeah… You may want to check this one out.


Now, I’m not one who usually puts up screenshots of projects here, especially games that aren’t finished, but I just felt that I had to show what I’ve got so far with this one…


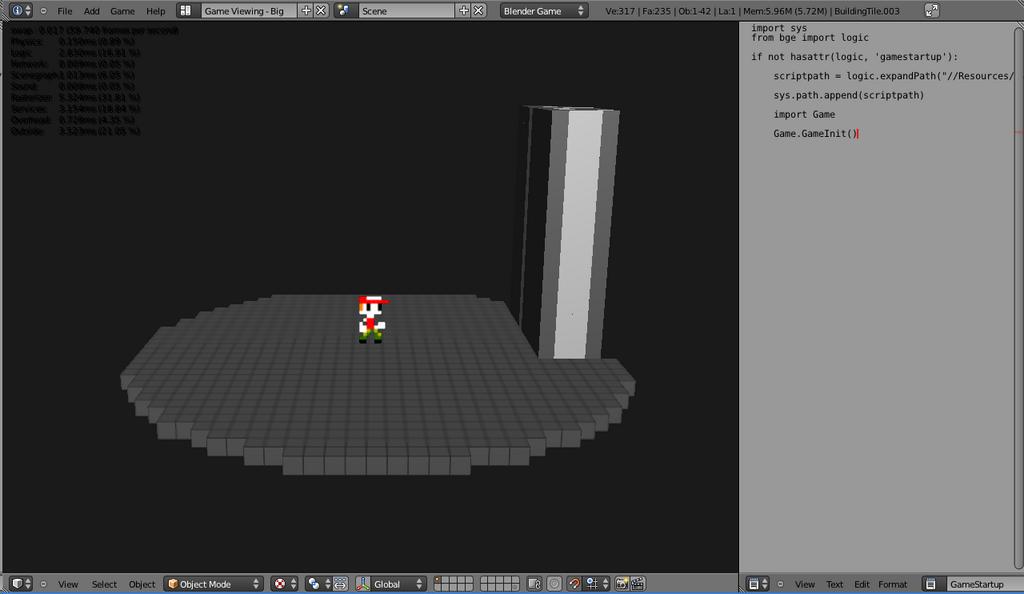
Yes, they’re voxels. I loop through a list of voxels (currently all of them in the scene, not even just the ones near the camera) to figure out if they should be visible or not. It works. Logic’s fairly low (16%, I think), and I’m going to keep working on it. Loop, people! LOOP!

EDIT: So it would seem that maybe my previous test was wrongly set-up, in particular because one scene used GLSL for a rendering-mode, and the other used Multitexture, which skewed the results. As Goran pointed out, he got the same FPS and logic values on both scenes, when they were setup correctly. The correct blend can be downloaded from post #13.

very interesting. I’m getting 70 FPS on the eachlogic and 150 on the loop scene. Very nice idea, I’ll see about implementing this into my game. THanks a lot! :wink:

Hmm… when I add a simple print(x), it slows the FPS down to 3. This is probably not a problem as it is doing it lots of times per second for 10,000 objects.

If you’re looping through the calculations for all the objects at once and tell each object to print something, it will flood the console with messages and thus destroy your performance, you’d have to make sure you have just one object from the list that’s actually printing something.

Anyway, I was just thinking the other day a similar method of how logic could be sped up in cases by running a common object’s logic from a master script that’s only run by a central object like the character. (like get the object that the player collides with and run logic for that object instead of having collision sensors for every one of the objects)

Yeah, I wouldn’t advise using the print function with either the Each or Loop Logic methods (printing isn’t exactly a FPS-less function), but the performance increase still stands for normal game logic. It’s really useful, particularly if you have a group of objects that you need to compute logic on, like enemies or particles. I’ll have to try implement this into my X-Emitter system.

Ace Dragon: Yes I know, as I said in the last part of my post :stuck_out_tongue:

I think this will be especially helpful for objects that use the same script, stuff like LoD.

@Ace - I just now read the last half of your post - that sounds like a good idea. The performance increase would only stay if you limit the amount of objects running scripts. sevi_ mentioned in another thread an ‘impulse’ system - if you combine his idea with yours, it would sound like this -

When the Player collides with an object, it gets the object and sets its ‘impulse’ variable to 1. There would be a property sensor that runs a script on the enemy so that when impulse is 1, then the script runs (and only then) - it sounds like it would be good, but it still would require sensors and scripts on the objects themselves, thereby bringing the overhead back up. I tested out running a script in each object rarely versus looping through them on every frame, and Loop Logic won by a landslide.

I’ll have to try this in my game. Thanks for finding this out.

No, there’s a way where you wouldn’t have any logic bricks running on the objects themselves to start with (which can probably be combined with the loop logic method as well)

    • The other objects would start on a logic state that doesn’t have any bricks running.
    • The player script meanwhile will utilize the hitObject property through colObject = colSensor.hitObject
    • When the property of the object you want is found in hitObject, you use hitObject.state = # to change the state to one that would run logic.

So you have


collisionSensor = controller.sensors["collision"]

colObject = collisionSensor.hitObject

if 'myProp' in colObject:
    colObject.state = 1

Do note how states work though as it’s not just 1, 2, 3 ect…, even though there is a pattern, basic state switching (having just one state active at once) would work like this

first state - state = 1
second state - state = 2
third state - state = 4
fourth state - state = 8
fifth state - state = 16

and keep doubling for every additional state

I can say for myself the additional speed this can bring, I have levels in my 2D platformer that have so many point objects that all of them running their logic at once would cut the FPS around 50 percent, setting all of them to an inactive state to start with and having the core script set their states on collision to only run their logic then gave a tremendous boost to the FPS, simply because it means that only one or two at a time are actually running any bricks.

That is a good idea. However, that only will work with objects that need to run a script on collision, right? I mean, for something like a Goomba that needs to walk back and forth and turn around on collision with a wall, it would need to run a script every frame to check for that collision, correct? Or the wall could run the script.

There are a couple other options as well I can think of.

1). When a situation is reached that has to be activated, fetch the objects to be activated from the list of objects in the scene, the tricky part here might be getting the correct objects
2). Create an invisible ghost object around the player, and have it run a script setting the states of each object it collides with to an active state, a second object could also be used surrounding that to set the objects back to an inactive state.

In this situation you may have cases where the object is colliding with more than one object, thus meaning that the regular ‘hitObject’ variable may fail due to it only returning a single object, in this case you will want to use ‘hitObjectList’ which the initial coding is more complex, but allows much better management of collisions. Example code to set everything up below.


#get collision list information#
if CollisionSensor.positive==True:
    colObjectList = CollisionSensor.hitObjectList #create the list--
    length = len(colObjectList) #get the length of the list--
    
    #loop through the list items and assign to colObject#
    for x in range(0, length):
        
        #execute when there is a list#
        if length > 0:
            listCycle = colObjectList[x] #variable to report list objects--
            safe = length-1-ob['skip'] #use this to prevent out of range errors--
            
            #Do not consider objects with these properties in the list#
            if 'doNotConsider' in listCycle or 'alsoDoNotConsider' in listCycle:
                
                #allow proper handling of cases when there's consecutive list entries we don't want considered#
                if ob['skip'] < length-1: #prevent overflow errors--
                   ob['skip'] += 1
                    
                if length == 1: #If the object(s) we don't want is the only one in the list--
                    colObject = 'none'
                elif x == length and length > 1: #If the object(s) we don't want is at the end of the list--
                    colObject = colObjectList[0]
                elif x < safe and length > 1: #If the object(s) we don't want is in the middle of the list--
                    colObject = colObjectList[x+ob['skip']]
            else:
                safe = 1
                ob['skip'] = 1
                colObject = colObjectList[x]
                
else: #set default values for these variables when not being used--
    safe = 1
    ob['skip'] = 1
    listCycle = 'none'
    colObjectList = 'none'
    colObject = 'none'


This may look complex, but it should allow for most of the things you want to do (while ensuring that undesirable objects are not being looked at) using just a single ‘if’ statement in the places you need it like below.

if 'correctProp' in listCycle:

I don’t think you need the ‘if length > 0’, because if length = 0, then the ‘for x in range(0, length)’ won’t run. Anyway, that looks pretty interesting - I wonder how much of a better performance increase it’d be.

My reasoning behind that is playing it safe so as to not run that part of the code if there’s no list.

Also forgot the very last part of the code which I just added (the final else statement which resets the variables when the collision sensor isn’t positive, I ripped the code straight out of my game for posting here (though I changed a few names), and I forgot I had that last part)

Please note that the “EachLogic” scene is rendering in GLSL mode, while the “LoopLogic” scene is rendering in simple Multitexture.

Setting the same shading mode for both scenes will produce similar performance profiles, which confirms that this is a render-path bottleneck.

In the unbiased case (same shading modes), the “LoopLogic” scene is slightly faster (negligible difference), but this is only because the script controller is running in the old-fashioned “Script” execution mode (really, they should deprecate this one already).

Using “Module” execution, I noticed virtually identical performance profiles, as I initially suspected to be the case.

I attached the fixed .blend, so that you can see the results yourself.

Attachments

LoopVsEach.blend (492 KB)

Sorry about that - I didn’t note the difference in rendering modes until just today, when I linked this thread. :S
I should have been sure about that, so the previous test is indeed nullified.

When I tried out your blend file above, however, I note that LoopLogic’s scene is running at about 20-21% Logic, while EachLogic’s scene runs at about 30% Logic. Both scenes are running in Module mode. That might seem negligible, but Loop Logic is still a third faster than Each Logic, which is a big difference (i.e. 66 enemies calculating vs. 100).

I’m getting 20-21% in both cases … Might have something to with the fact that I’m running on Linux.

Unless you can actually notice the difference in framerate, from one setup to another, it’s wholly irrelevant (in my humble opinion).

When it comes to logic, I would advise anyone to do what’s easier, and what conceptually makes sense for their game - When your framerate starts dipping below 60, and you’re sure that it’s a CPU-bound issue, rather than a GPU-bound issue -> then it’s time to optimize, but not before then.

PS:

I don’t really trust the blender profiler (15 milliseconds to render the default scene? - looks like the “wait time” for the 60 fps cap is included) - I think the system’s CPU utilization info is much more accurate, in terms of actual “wall-clock” time … Framerate is king, in either case.

Actually, frame rate sucks for getting accurate measurements; frame time is king. Aside from that your are (mostly) correct by saying that the wait time for 60fps is included in the rasterizer. What is happening here is vsync. SwapBuffers() waits for a screen refresh to draw to avoid tearing. So, while the profiler shows 15ms for the default scene, it will continue to show 15ms (minus any time eaten up by whatever comes before the rasterizer) until you get enough stuff going to push the graphics to the point where everything cannot be done in between one screen refresh. At this point your rasterizer time will spike. This is one of the main reasons I’d like to see the BGE become multi-threaded. Then we could do logic or physics while waiting on the screen refresh.

Ah, so you could, for example, have a scene that’s drawing V-Synced to 60 FPS while doing physics or logic updates at 120 FPS, huh?

I was thinking a similar method of looping, as opposed to each’ing. Tis a nifty idea, I give you props.

But, on topic of your blend, and the render modes, I got 60 FPS on both scenes. I don’t know how to make it go any higher, I tired “Use Frame Rate” but they are both still on 60. But as I read all the replies, and compared it to my results. I got 9% logic and 80% overhead for the Loop scene, while I got 20% logic and 70% overhead with the Each scene. Not sure what is happening, but good job.

TomCat

@Hellooo - Thanks, but as Goran pointed out, the test I had was rigged, essentially. :S Sorry about that - I didn’t notice it until pretty much yesterday. Getting the blend file from Goran’s post (#13) shows that there’s not much difference, if any, depending on what kind of machine you’ve got.

Yes, for accurate measurements (that was my point); I was referring to when one should decide to optimize, and in my opinion, one should do so when the frame-rate drops significantly below 60.

So, that’s what I meant by “Framerate is king”. But yes, for accurate performance measurements, it’s frame time that I would be interested in.

What is happening here is vsync. SwapBuffers() waits for a screen refresh to draw to avoid tearing. So, while the profiler shows 15ms for the default scene, it will continue to show 15ms (minus any time eaten up by whatever comes before the rasterizer) until you get enough stuff going to push the graphics to the point where everything cannot be done in between one screen refresh. At this point your rasterizer time will spike. This is one of the main reasons I’d like to see the BGE become multi-threaded. Then we could do logic or physics while waiting on the screen refresh.
I don’t understand how additional threads will help to exclude vsync wait time from the calculation (sounds like a SwapBuffers issue), but, if you have it figured out, then that’s great.

PS:

I have a simple patch in the tracker, that addresses what I think to be a bug in applyImpulse: http://projects.blender.org/tracker/index.php?func=detail&aid=29419&group_id=9&atid=127

I don’t know if I should ask you to look at it, or is Dalai the person to ask, or someone else?