Bar-Graph-O-Matic / piechart help please

(Not been using Blender much and still a newb)

I’ve been searching the forums for piechart python scripts and stumbled upon the Bar-Graph-O-Matic page but i don’t understand how to install and get it working. I’m using V 2.57 on OSX.
The txt document instructs to put part of the script in a folder that i don’t seem to have!

http://wiki.blender.org/index.php/Extensions:2.4/Py/Scripts/Misc/Bar-Graph-O-Matic

I would ideally like to find a working piechart script but the only link i have found was by fambros and i can’t get that to work either!

If anyone can help with either of the above I’d very much appreciate it.

Mike

Hmm … converted evt. another pie (ACP) to 2.59 try:


import bpy
from add_utils import AddObjectHelper, add_object_data
from math import sin,cos,pi,radians
from mathutils import Vector

#Pie slice parameters
ang = 16.0
r_ang = 0.0 #rotation angle
unit = 2.5 #angle to set the mesh detail
ragg = 2.0 #radius of the pie chart
h = 0.5 #high of the pie chart
rad= pi/180
bang = unit
faces = 0
bangx = 0.0
scn = bpy.context.scene

#REALIZZAZIONE DELLO SPICCHIO INF --------------------------------------
def b_inf(ang, ragg, unit, bang, rad, h):
    polyline= [Vector((0, 0, 0)), Vector((-ragg, 0, 0))]
    bang = unit
    #use radians
    counter = 1
    faces = []
    while bang < ang:
        polyline= polyline + [Vector((-sin((90-bang)*rad)*ragg, sin(bang*rad)*ragg, 0))]
        counter += 1
        faces.append([0,counter - 1, counter])
        bang=bang+unit
    polyline= polyline + [Vector((-sin((90-ang)*rad)*ragg, sin(ang*rad)*ragg, 0))]
    counter += 1 
    faces.append([0,counter - 1, counter])
    mesh = bpy.data.meshes.new(name='pie')
    mesh.from_pydata(polyline, [], faces)
    add_object_data(bpy.context, mesh, operator=None)
    obj = bpy.context.active_object
    obj.name = "mypie"
    obj.location = (0,0,0)
    mesh.update(calc_edges=True)
    mesh.validate(verbose=True) 
    bpy.ops.object.editmode_toggle()
    bpy.ops.mesh.extrude_region_move(MESH_OT_extrude={"type":'VERTS'}, TRANSFORM_OT_translate={"value":(0, 0, -h), "constraint_axis":(False, False, False), "constraint_orientation":'GLOBAL', "mirror":False, "proportional":'DISABLED', "proportional_edit_falloff":'SMOOTH', "proportional_size":1, "snap":False, "snap_target":'CLOSEST', "snap_point":(0, 0, 0), "snap_align":False, "snap_normal":(0, 0, 0), "texture_space":False, "release_confirm":False})
    bpy.ops.mesh.select_all(action='SELECT')
    bpy.ops.mesh.normals_make_consistent(inside=False) 
    bpy.ops.object.editmode_toggle() 

b_inf(ang, ragg, unit, bang, rad, h)

Make it an Operator and add a GUI :wink:

there’s a script on blenderheads forum that does this, even taking data from an xml file for accurate labled charts.

Hi Meta-Androcto,
a link would be useful :wink:

EDIT, got it from Meta-Androcto, thanks again :wink:
http://www.blenderheads.org/forums/es/viewtopic.php?f=15&t=751

The script works nearly … cubes and cilinders but not the PIE, giving strange (not yet understood ) error :mad:
AttributeError: ‘NoneType’ object has no attribute ‘cause
Traceback (most recent call last):
File “C:\Users\Peter\25blender\blenderlatest\2.59\python\lib raceback.py”, line 269, in format_exc
format_exception(etype, value, tb, limit, chain))
File “C:\Users\Peter\25blender\blenderlatest\2.59\python\lib raceback.py”, line 180, in format_exception
for value, tb in values:
File “C:\Users\Peter\25blender\blenderlatest\2.59\python\lib raceback.py”, line 122, in _iter_chain
cause = exc.cause
AttributeError: ‘NoneType’ object has no attribute ‘cause

Changing the Pie part a little bit one can get it to work see example

Attachments


line 114 use return{“FINISHED”}
hmm, nope that did not do it…

I get errors too from the script I fetched from Blenderheads.
Does anyone have an example CVS file that we can work from?
Is that the only way to populate the graph?

Got it working :wink: though the Pie is not at the good place (but easy to repair!)
Several problems: replace everywhere (“FINISHED”) by {‘FINISHED’}
Meaning: brackets => curly brackets

Then there is a problem with path variable pointing to the absolute path of you csv!

The registration and unregistration is not ok!

Some check of the path length are doubt full,
Question: What is the shortes absolute path to a csv (windows len(“C:/1.csv”) --> 8 (not 12)
*UX I think len("/1.csv") --> 6 so use THAT ? replace ‘ruta.csv’ by “1.csv” and check for it hopefully once only

If I have made it working (under 2.59) I will show you the code … :yes:

EDIT:
not yet perfect but works nicely …

see here: http://blenderpython.svn.sourceforge.net/viewvc/blenderpython/259/scripts/addons_extern/chart_generator/
for the files :wink: (thanks to meta-androcto!!!)

Thanks for all the work on this so far.

Can you please explain how i actually use this within blender.
I’ve downloaded the files but don’t understand the steps needed to work with them and populate and pie charts/graphs.
Please help and sorry for being so demanding.

Ahh - I just watched the vimeo link and although i don’t speak language other than English I think I understand how to start to use this now.

Many thanks for now.

The pie seems to work ok but neither the bar or cylinders work for me.

I’d also like to be able to sharpen the edges of the pie-chart, where each slice meets the next. Is thee a way to do this?
I see that the chart is made using bezier curves and modifiers but i haven’t worked out how to sharpen these edges.

Wait a little bit, new version will be submitted soon :wink:

Will have a look: you would like just not rounded pieces in the pie, will have a look (after my nap)…

get the init.py as well as the Readme.txt (test Map1.csv or your own csv comma separted values)
rename init.py to chart.py put it in the addons directory etc.

fill rim is set! maybe remove that … to get sharp pies. maybe then the number of should be bigger dependent on the angle of the pie

Attachments


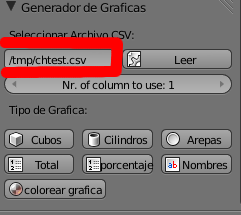
So now it is ok to some degree , gui only showing choices, if an absolute path to an csv (comma separated numbers, first maybe text, 2 or more colums) is given.
using this


import bpy
from random import random
def makeMaterial(name, diffuse, specular, alpha):
    mat = bpy.data.materials.new(name)
    mat.diffuse_color = diffuse
    mat.diffuse_shader = 'LAMBERT' 
    mat.diffuse_intensity = 1.0 
    mat.specular_color = specular
    mat.specular_shader = 'COOKTORR'
    mat.specular_intensity = 0.5
    mat.alpha = alpha
    mat.ambient = 1
    return mat
#global lightGrey
#lightGrey = makeMaterial('lightGrey',(0.91,0.91,0.91),(1,1,1),1)
#darkRed = makeMaterial('darkRed',(0.91,0,0),(1,1,1),1)

objTypes =['Cylinder','Cube','BezierCurve']
def setMaterial(ob, mat):
    me = ob.data
    me.materials.append(mat)

allCube = [el for el in bpy.data.objects if el.name.startswith('Cube')]
allCylinder = [el for el in bpy.data.objects if el.name.startswith('Cylinder')]
allBezierCurve = [el for el in bpy.data.objects if el.name.startswith('BezierCurve')]
ranCols = [(random(),random(),random()) for el in range(len(allCube))]
for nr,obj in enumerate(allCylinder          ):
    print(nr, obj.name)
    mat = makeMaterial(obj.name,ranCols[nr],(1,1,1),1)
    setMaterial(obj,mat)
for nr,obj in enumerate(allBezierCurve):
    print(nr, obj.name)
    mat = makeMaterial(obj.name,ranCols[nr],(1,1,1),1)
    setMaterial(obj,mat)
for nr,obj in enumerate(allCube):
    print(nr, obj.name)
    mat = makeMaterial(obj.name,ranCols[nr],(1,1,1),1)
    setMaterial(obj,mat)

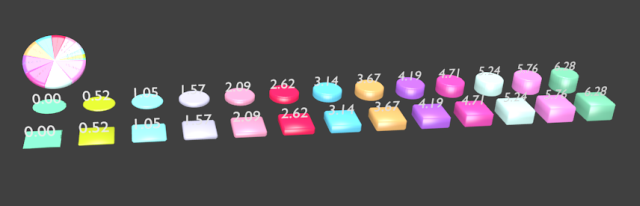
random colors to the same values are given :evilgrin: see picture

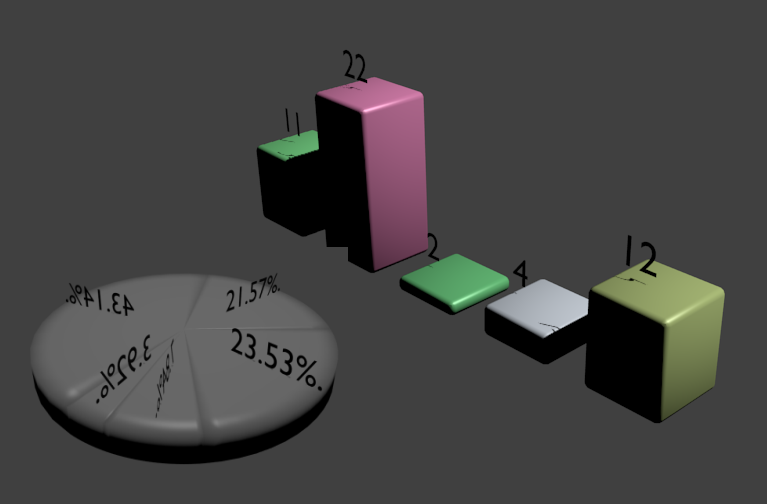
Negative values are possible for cubes or cylinders, but than no %tage is shown etc.
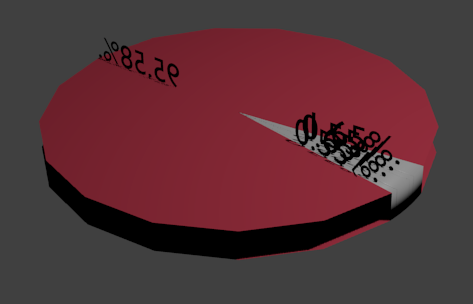
in the pie-case negative values are discarded (not meaningfull in a pie) …

Attachments


Thanks once again PKHG that all looks good to me… although now i can’t use it at all!

I just deleted the Blender app and re-installed V2.59
Can you please walk me through the whole process of getting this working so that i do not make any more mistakes…i have tried installing the chart_generator_PKHG.py as an addon but i canot get it to work.

So sorry for taking up all your time.


Hi, myfreindmike, after activating the addon you have to look at the tools (in the 3DVIEW, T is the toggle) there the addon occurs but not really activated, because it needs INPUT(see picture) a csv file, comma separated columns (get Map1.csv as example)! It points to a probably not available file ruta.csv you have to replace it by an ‘absolute’ adres to the file with data!
I have Map1.csv as chtest.csv on c:/tmp then you need to type c:/tmp/chtest.csv into that field and THEN you get the options to play with,
see second picture!

Hi PKHG.
I have had the previous version working somewhat but now when i try to install your chart_generator_PKHG.py addon using the INSTALL ADDON from within user preferences it just does not install at all, even when i have ALL selected in the preference addons teb
If I install chart_generator.py using the same method it shows up but it doesn’t seem to work properly. I would like to get your updated version to work.
I am now using blender V 2.59 on Mac OS X.6.8


Hmm, I am not on a Mac … so if that is a problem … I do not know.
BUT a third person just created charts with the addon (windows presumable) so it works :wink:
so get chart_generator_PKHG.py
and put it as text into a a TEXT window of Blender (use e.g. Scripting and New…) and execute it from there

Hope this will work …

Hi PKHG.
Thanks again.
i deleted the version i had and downloaded it again.
The install went fine and it seems to be working now.

Many thanks.

your are welcome , maybe I should put the remarks from the Readme (you read it?!) into the addon …