Hey all, i just thought i’d mention this while my mind is still clear!
In the BGE, the one thing that i find i would like is a graphic profiler.
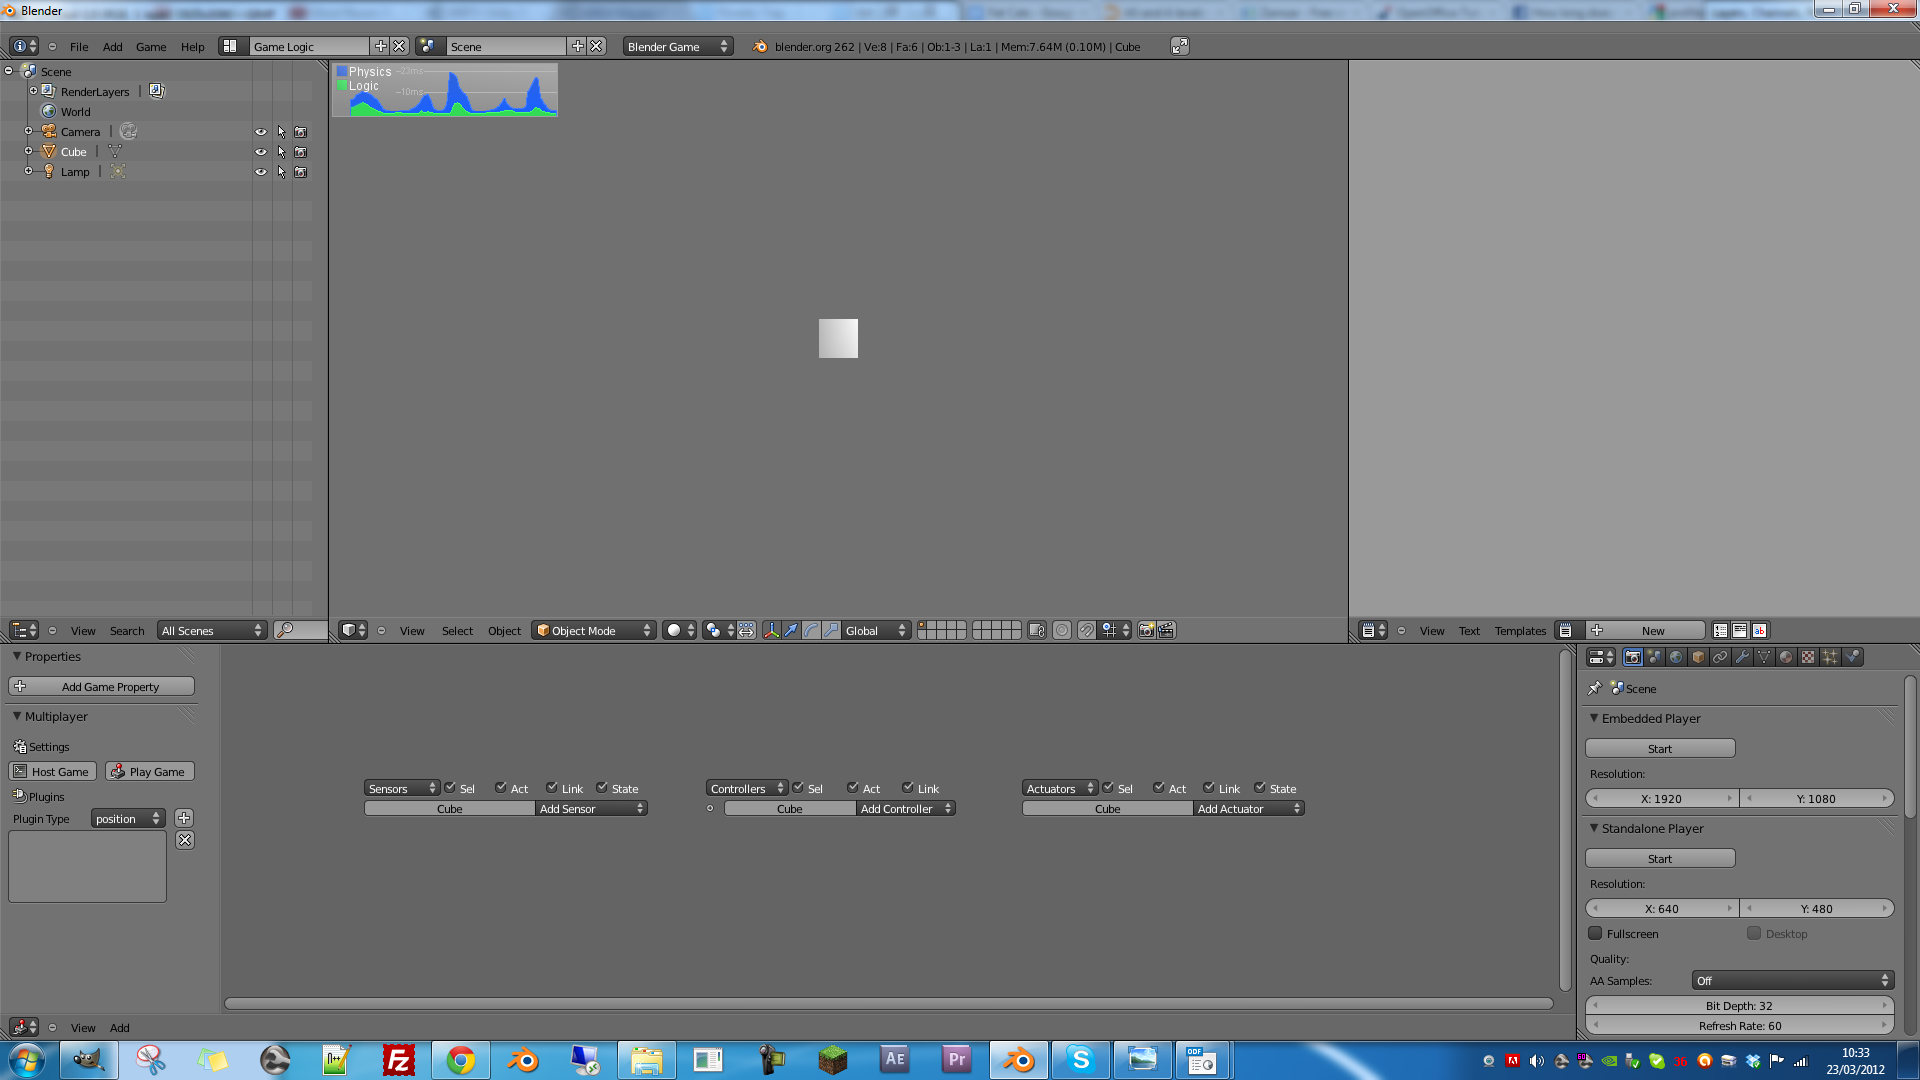
In the same sense as Unity, i would like to be able to see spikes that i may miss in the number panel. I think having a graphing function would do the following:
- Enable quick and easy identification of bottlenecks
- Understand the time scale during which a bottleneck occurs
- Enable a broader comparsion between different areas of the GE which are inter-related (e.g Logic lag due to Network lag)
In order to expand functionality, i’d also like to propose a few additions:
- Profiling data (graph) is available post execution, for improved debugging
- Increased detail in the profiling output *
Now, as of the moment, I am far too limited to attempt to implement this into the Game Engine source.
So, i’m interested to know if anyone shares my opinion?
*This would potentially show the calls from Python that would slow down logic execution - to better discover bottlenecks within the code. I’m not sure how you’d extract this from the interpreter though.