
stanton.blend (1.11 MB)
please bear with me. i’ve only just started using blender (this is also the case for gdal). i suspect that there might be far more efficient approaches to reaching a similar goal, but i couldn’t find any such information.
i would like to outline how to use digital elevation model (DEM) files (or essentially any elevation data gdal can manipulate - which is an impressive number) in blender to create 3d maps of real word data.
in this tutorial, i will use an area in the alps around st. anton am arlberg in austria as an example.
to follow these instructions you will need to install gdal (http://www.gdal.org/). it is available for windows, mac and most common linux distributions should have this available in their repositories.
i use version 1.9.2 on gentoo. i’m sorry that i can not provide information on how to use this program on windows. perhaps someone else might be able to help with this: http://trac.osgeo.org/gdal/wiki/DownloadingGdalBinaries
also we will use gdal on the command line. the commands are straight forward and are explained in detail.
commands executed on the command line are prefaced with a ‘$’ symbol
- Find out what region we are interested in
we can get this information from http://openstreetmap.org.
example osm map:
in the top left area, there is an ‘export’ link, which will open an area on the left hand side describing the area you want to export. make a note of the coordinates in this panel.
example area to export:
            47.2259

    10.2176         10.4226

            47.0926
the values you get might vary as these are dependent on the visible area in the browser window. the center of the map should be the same but the bounding box is dependent on the resolution of the screen.
you should also export the map image as png file for later use in blender as a background image to position labels easily.
now we know the coordinates of the area we are interested in. next we…
- Get the DEM data
firstly, you will need the relevant DEM files. a decent source might be http://www.viewfinderpanoramas.org/dem3.html where you can download elevation data in 1, 3 or 15 arc seconds resolution.
example data to download:
N47E010: http://www.viewfinderpanoramas.org/dem1/N47E010.zip
the name of the file describes what coordinates it contains: north 47 degrees and east 10 degrees. this file will contain the coordinates we got from openstreetmap.org.
- Extract region
once you’ve downloaded your relevant area, unzip it and you will see the N47E010.hgt file. we will use gdal to manipulate this data.
from earlier we know the exact coordinates of the region we wish to extract:
            47.2259

    10.2176         10.4226

            47.0926
with this information, we can extract the desired region we want from the hgt files using gdal. gdal consists of a number of different tools and allows you to manipulate a great number of elevation and gps data. the tool we want to use is called gdalwarp.
usage of the relevant gdalwarp options:
$ gdalwarp -te <x_min> <y_min> <x_max> <y_max> in.file out.file
example gdalwarp usage using the osm data from above:
$ cd path/to/where/you/extracted/N47E010.hgt
$ gdalwarp -te 10.2176 47.0927 10.4226 47.226 N47E010.hgt stanton.hgt
if you should have a region that overlaps hgt files, you can simply add all relevant *.hgt files after each other.
$ gdalwarp -te <x_min> <y_min> <x_max> <y_max> first.hgt second.hgt ... clipped-region.hgt
- Convert DEM data to image
now we have the desired elevation information in a file but we need to convert it to a useful file format that we can work with. we will convert it to a GeoTIFF image. as far as i understand, this is a special type of tiff image that can be viewed and manipulated like any other tiff but also contains GPS and elevation data. in any case, we will convert our hgt to tiff using gdaldem.
to convert the elevation data to an image, you need to tell gdaldem what colours you wish to use. this is done with a colour configuration file. we will use a simple black to white gray scale since we want to use it as a displace modifier. you can potentially insert lines at specific elevations or have specific elevations have specific colours. anyway, here is the colour configuration file we will be using:
100% 255:255:255
0%   0:0:0
nv   0:0:0
copy the above into a file and save it in the same directory as your N47E010.hgt file called ‘relief.clr’
example file format conversion from hgt to tiff:
$ gdaldem color-relief -of GTiff stanton.hgt relief.clr stanton.tiff
- color-relief is the desired output mode
- -of GTiff is the output format --> GeoTIFF
- stanton.hgt is the clipped hgt file generated above
- relief.clr is a color configuration file (see above)
- stanton.tiff is the output file
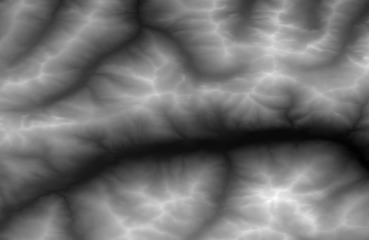
now you should have a tiff image that resembles the one below.
- Use tiff image with displace modifier in blender
- remove default cube
- add plane and scale it 5x
- enter edit mode and subdivide plane a few times
- exit edit mode
- add subsurf modifier
- add displace modifier, use the stanton.tiff as displace texture and adjust the strength to suit your needs. if you have artifacts at the edge of the map, make sure to set image mapping to ‘clip’ or ‘extend’.
additional tips:
- using map from osm.org as background image in view to position labels:
if you use an image from osm.org to position labels in the elevation map, you will have to scale the plane to align with the image. also make sure to have the background image in the front. see the stanton.blend (1.11 MB) file.
- elevation lines using a cycles material:
as i mentioned above, i’ve only just started playing with blender so this material is probably a bit convoluted but might serve as a starting point for an experienced blenderhead. again, see the stanton.blend (1.11 MB) file.
- getting large area osm map with high resolution:
downloading larger areas as image from osm.org is prevented to avoid server overload. this can be done using this great site:
http://openstreetmap.gryph.de/bigmap.html
- importing osm data:
you can import osm data into blender directly by exporting relevant osm data from osm.org or downloading it from a number of sources and importing the osm data using the osm import addon. this will allow you to display houses, streets and other points of interest. anyway, this should serve as a starting point should you want to display real world 3d data.
hope this helps someone out there and saves them some time.