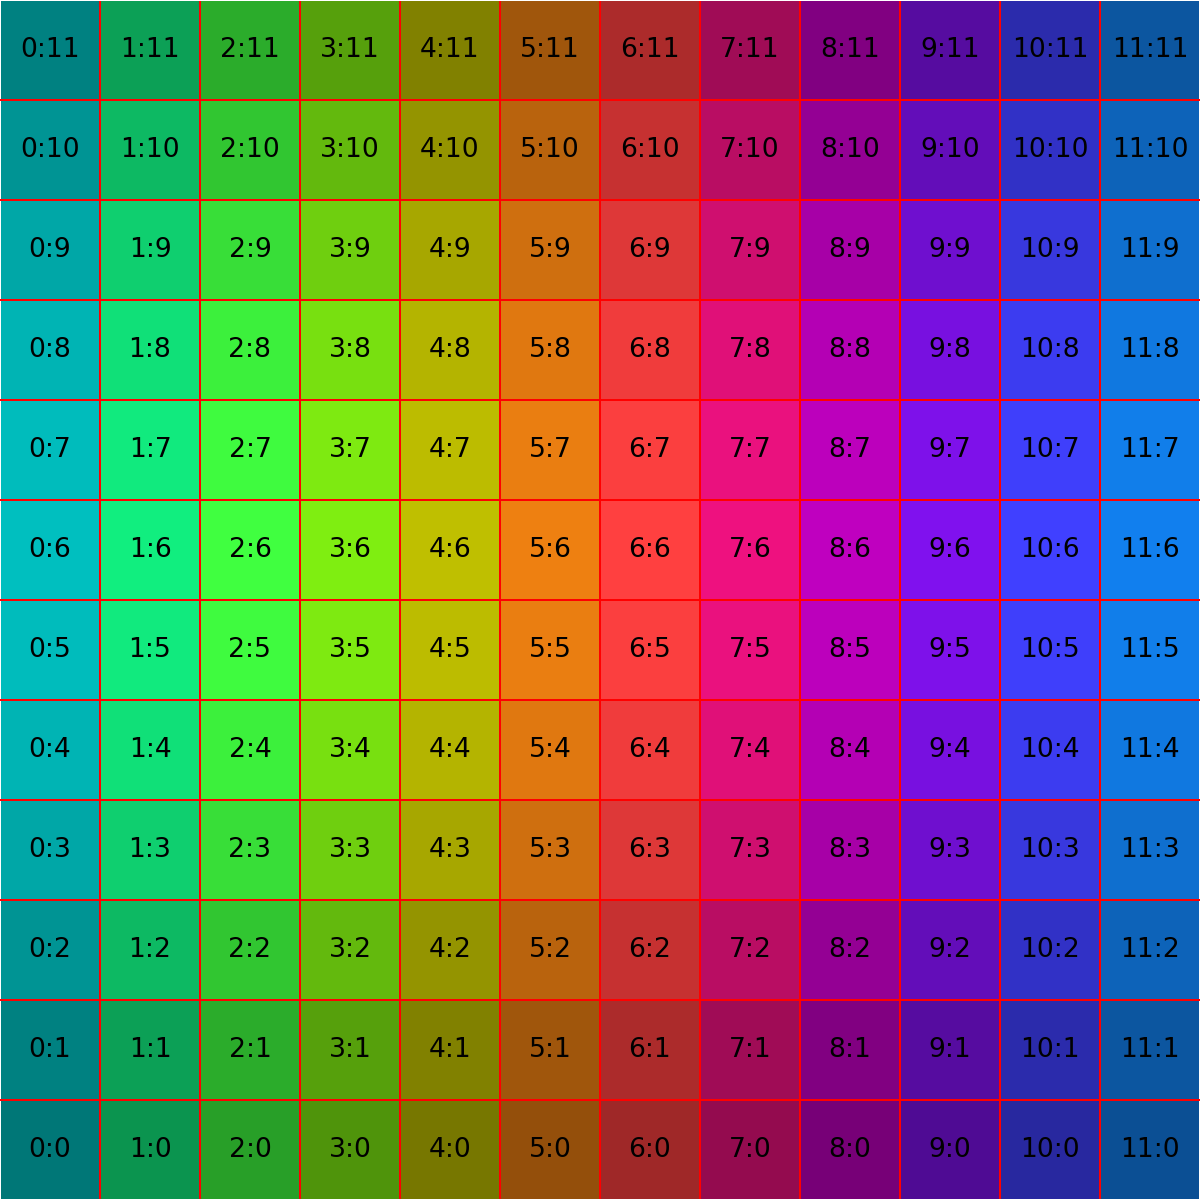
Hi, i want to share a simple colorgrid generator script based on matplotlib.
- generates an nxm colorgrid with rectangles of defined pixel length.
- each rectangle has an uv index
- color (hue) of rectangles changes cyclical in u direction
- (chroma) of rectangles changes cyclical in v direction
- the rectangles are separated by lines
- the coordinate axes are white
Note that matplotlib is not included as embedded python-module in blender.
You can’t use this script inside a default blender.
I use an external python with the same version as the embedded blender python.
I hope it is helpful.
import matplotlib.pyplot as plt
import matplotlib.lines as mlines
import matplotlib.patches as mpatches
import math as m
# functions
def color1(i_x,n_x,i_y,n_y,a0,a3):
    return((i_x/n_x), (1-i_y/n_y), a0, a3)
#
def color2(i_x,n_x,i_y,n_y,a_offset,a_sigma):
    '''
    a_offset in [0,1]: alpha offset
    a_sigma in [0,1] : alpha sigma
    '''
    # cyclic color and alpha
    # phase
    phi_x  = 2*m.pi*i_x/n_x
    phi0_x = 0.0 # m.pi
    phi_y  = 2* m.pi*i_y/n_y
    # alpha
    a = (a_offset +(1-a_offset)*(1-m.cos(phi_y))/2)**a_sigma
    # color
    R = a*(1-m.cos(phi_x-2*m.pi/3+phi0_x))/2
    G = a*(1-m.cos(phi_x+phi0_x))/2
    B = a*(1-m.cos(phi_x+2*m.pi/3+phi0_x))/2
    return(R,G,B)
## main
# grid
rec_pix  = 100  # pixels per rectangle
n_x, n_y = 12,12  # rectangles grid dimension in natural numbers
# resolution
x_pix ,y_pix = n_x*rec_pix, n_y*rec_pix # output resolution file
my_dpi = 96 #ppi my monitor
# fontes
#share parameters across many text objects and labels
#by creating a dictionary of options passed across several functions
font = {'family': 'serif',
        'color':  'darkred',
        'weight': 'normal',
        'size': rec_pix/5, # pixel
        }
# fig
fig = plt.figure(figsize=(x_pix/my_dpi, y_pix/my_dpi),# inches
                 dpi=my_dpi)
# loop: rectangles, text
a0 = 0.15 # offset alpha
a3 = 1/4 # sigma  alpha
for i_x in range(n_x):
    for i_y in range(n_y):
        rec_color = color2(i_x,n_x,i_y,n_y,a0,a3)
        # patches
        rec = mpatches.Rectangle((i_x/n_x,i_y/n_y)
                                ,1/n_x,1/n_y
                                ,figure=fig
                                ,transform=fig.transFigure # coords, dimensions in [0,1]
                                ,facecolor=rec_color)
        fig.patches.extend([rec])
        # text
        fig.text(
          (i_x+0.5)/n_x,(i_y+0.5)/n_y
          ,str(i_x)+":"+str(i_y)
          ,color=(0.0,0.0,0.0)
          ,fontdict=font
          ,transform=fig.transFigure # coords in [0,1]
          ,ha="center", va="center")
# lines
ax_color = 'w' # axis lines color
co_color = 'r' # coordinates lines color
for i_x in range(n_x+1):
    if i_x == 0 or i_x == n_x:
        line_color = ax_color
    else:
        line_color = co_color
    lx = mlines.Line2D([i_x/n_x,i_x/n_x],[0,1]
                      ,figure=fig
                      ,transform=fig.transFigure # coords in [0,1]
                      ,color=line_color)
    fig.lines.extend([lx])
for i_y in range(n_y+1):
    if i_y == 0 or i_y == n_y:
        line_color = ax_color
    else:
        line_color = co_color
    ly = mlines.Line2D([0,1], [i_y/n_y,i_y/n_y]
                      ,figure=fig
                      ,transform=fig.transFigure # coords in [0,1]
                      ,color=line_color)
    fig.lines.extend([ly])
# output
fig.savefig('ColorGrid'+str(n_x)+'x'+str(n_y)+'_'+str(rec_pix)+'.png', dpi=my_dpi)
plt.show()
# cleanup
plt.close(fig)