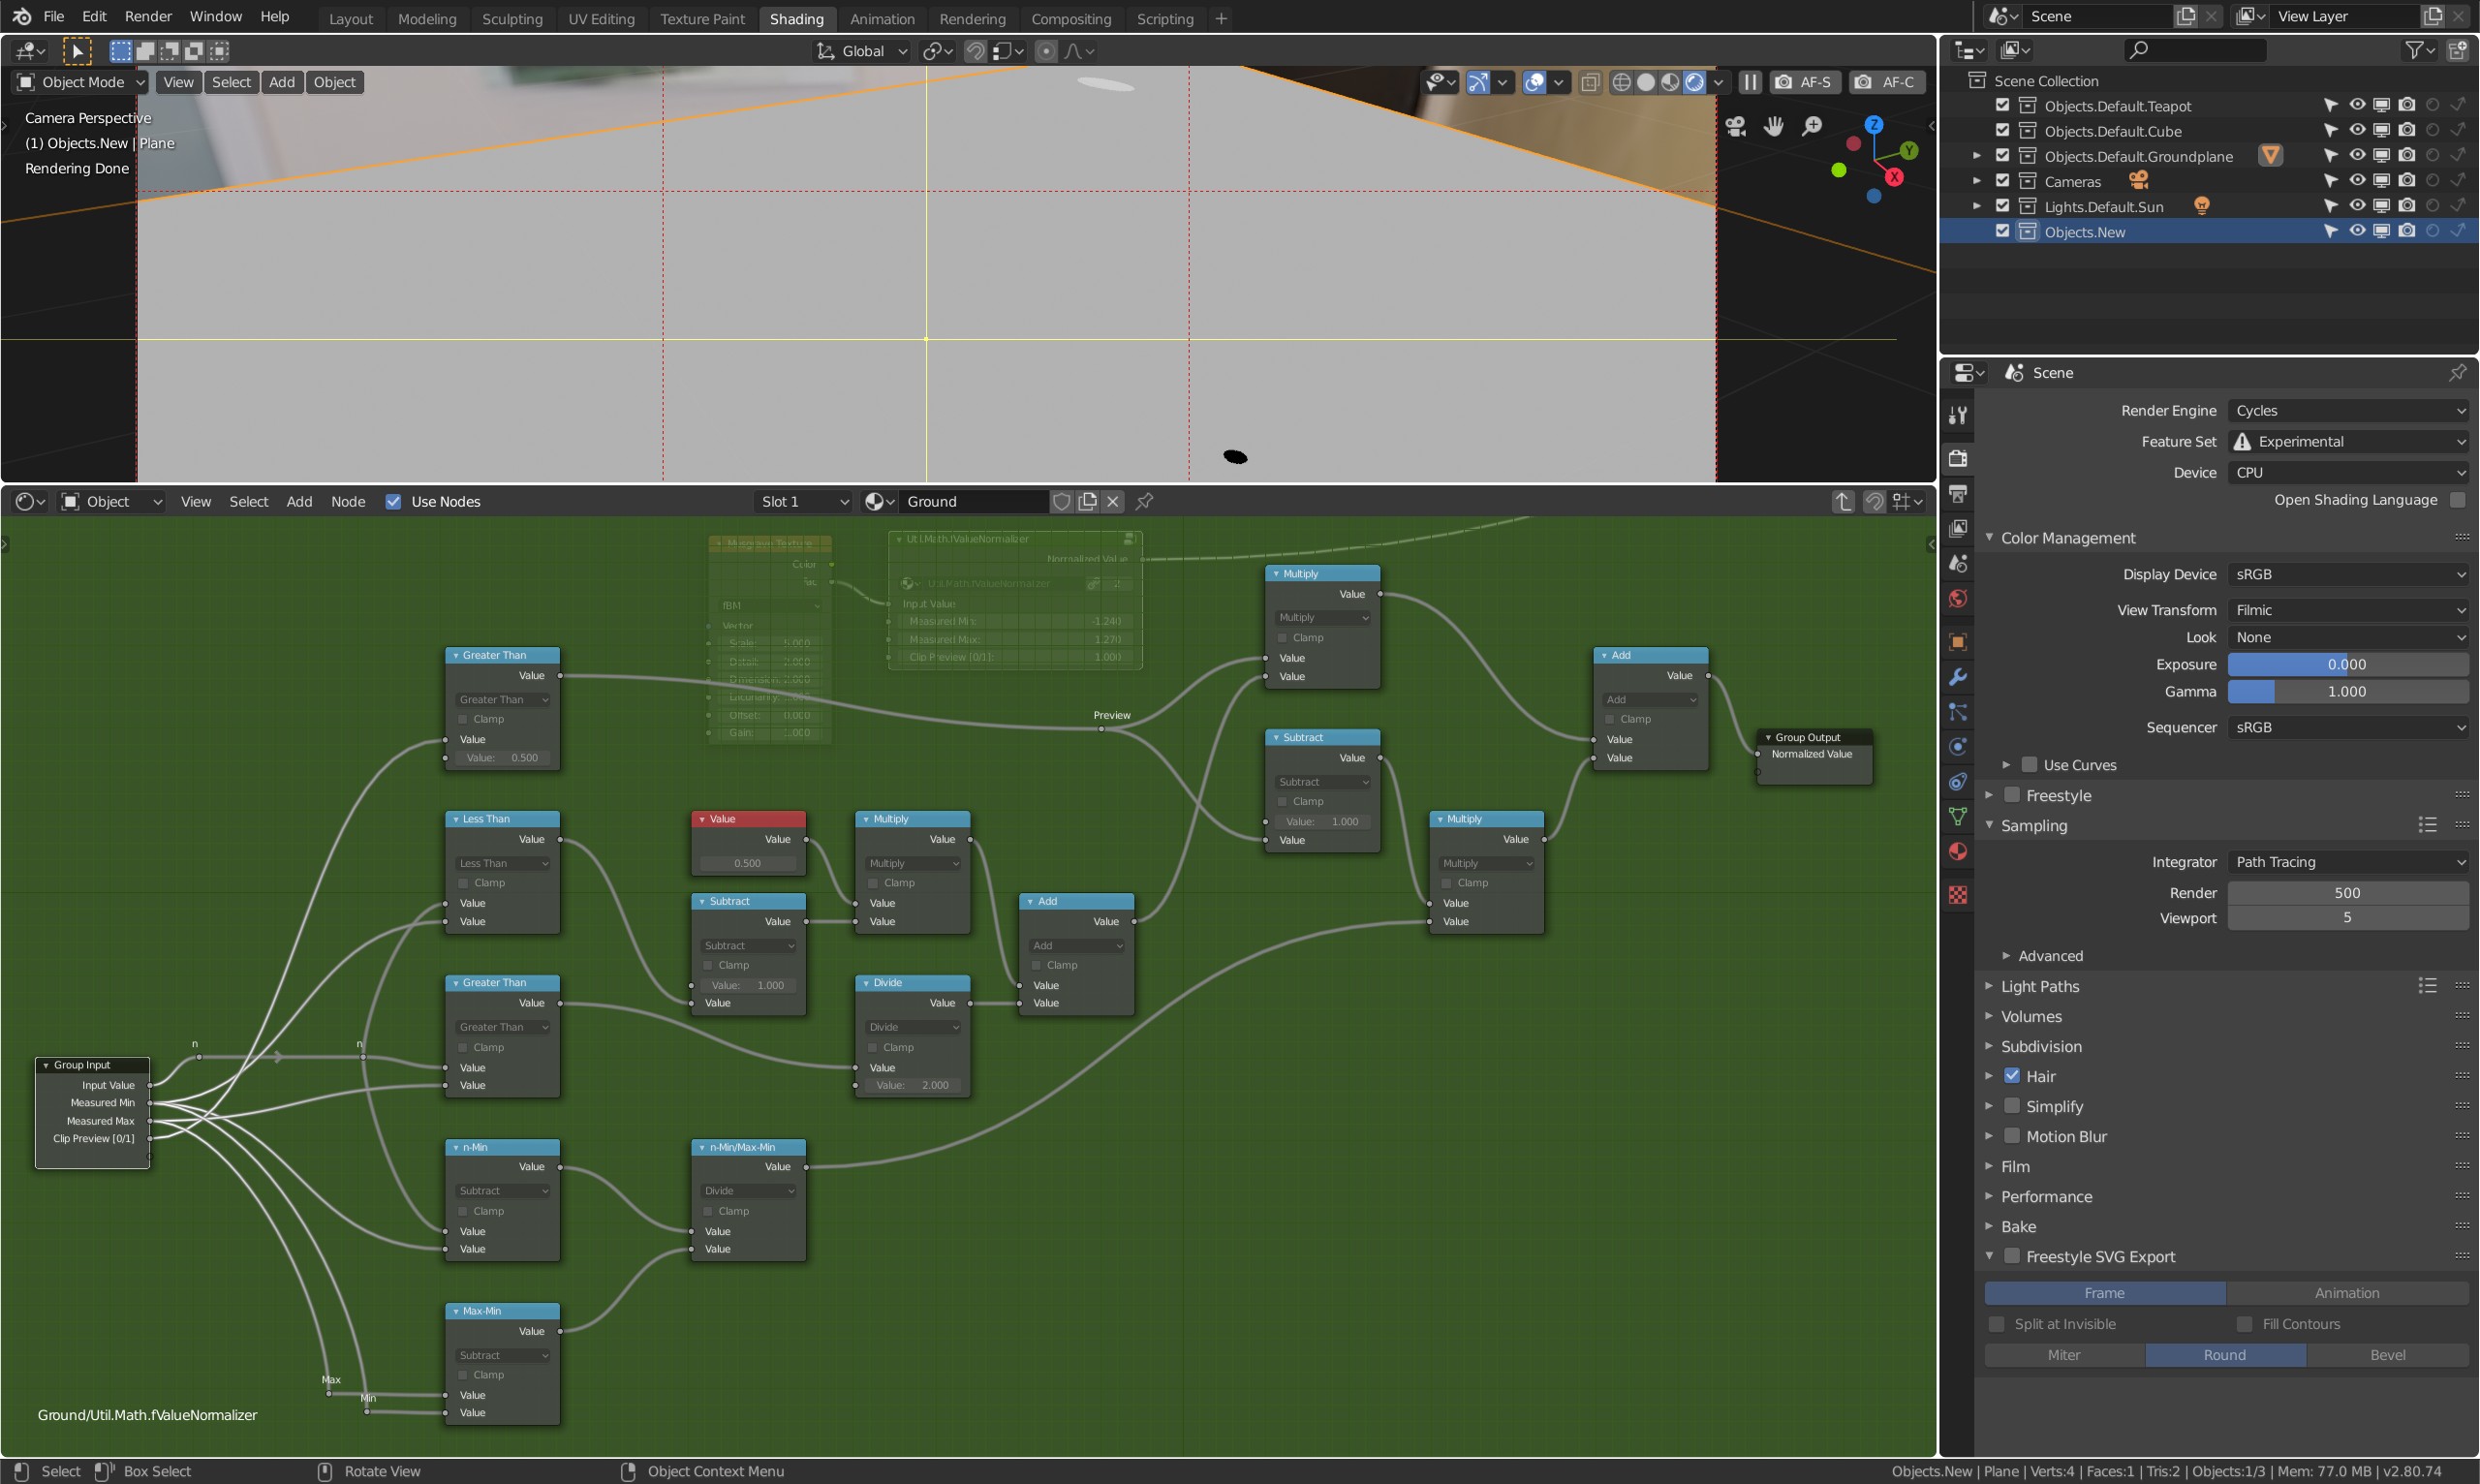
After applying math nodes to coordinates and clicking preview with node wrangler we get visual representation of results. But when we see a gradient representing coordinates we don’t really know wether black means 0 and stop or 0 and negative numbers go on. Or when I see gradient We don’t really know wether it’s from 0 to 1 or from 0 to 2.
It makes debugging procedural stuff a real pain in the ass. Maybe some of you know the solution for better visualization of it?
- Make sure to stay in 0-1 range whenever possible.
- Switch to None display device for a gradient that is better to debug.
- Preview to a microdisplaced strip of geo.
- Make a normalize node group so that you can tame the stuff that lies outside (i.e. Musgrave generator).
The preview “switch” is important. Enable it to tweak the values until you get a solid grey, then switch it off. The output value should now be between 0 and 1.
(Clark Kent voice): “This is a job …”
(Superman voice): “… for OSL!”
How about this:
shader gradient_view
  (
    float InputValue = 0,
    float MeasuredMin = 0,
    float MeasuredMax = 1,
    int ClipPreview = 0,
    output float NormalizedValue = 0
  )
  {
    if (ClipPreview)
      {
        NormalizedValue =
            InputValue >= MeasuredMin && InputValue <= MeasuredMax ?
                0.5
            :
                0;
      }
    else
      {
        NormalizedValue =
                (InputValue - MeasuredMin)
            /
                (MeasuredMax - MeasuredMin);
      } /*if*/
  } /*gradient_view*/
A bit easier to copy and paste, rather than trying to recreate a setup involving more than dozen nodes?
Probably works, didn’t check. OSL’s issue of course is that it won’t run on CUDA/OpenCL (?) GPU rendering modes. And I often use it to control Musgrave outputs “live” in material setups, and other outputs where I don’t feel like doing the math to normalize it.
Also, earlier in beta period I couldn’t use microdisplacement and OSL.
I’ve also had issues with OSL and IES lights. OSL is only occasionally useful, I can’t rely on it.
Maybe these issues have been addressed with RC1, I haven’t checked yet.
Example from tonight, where I use it twice in the beginning, to drive microdisplacement ++ :
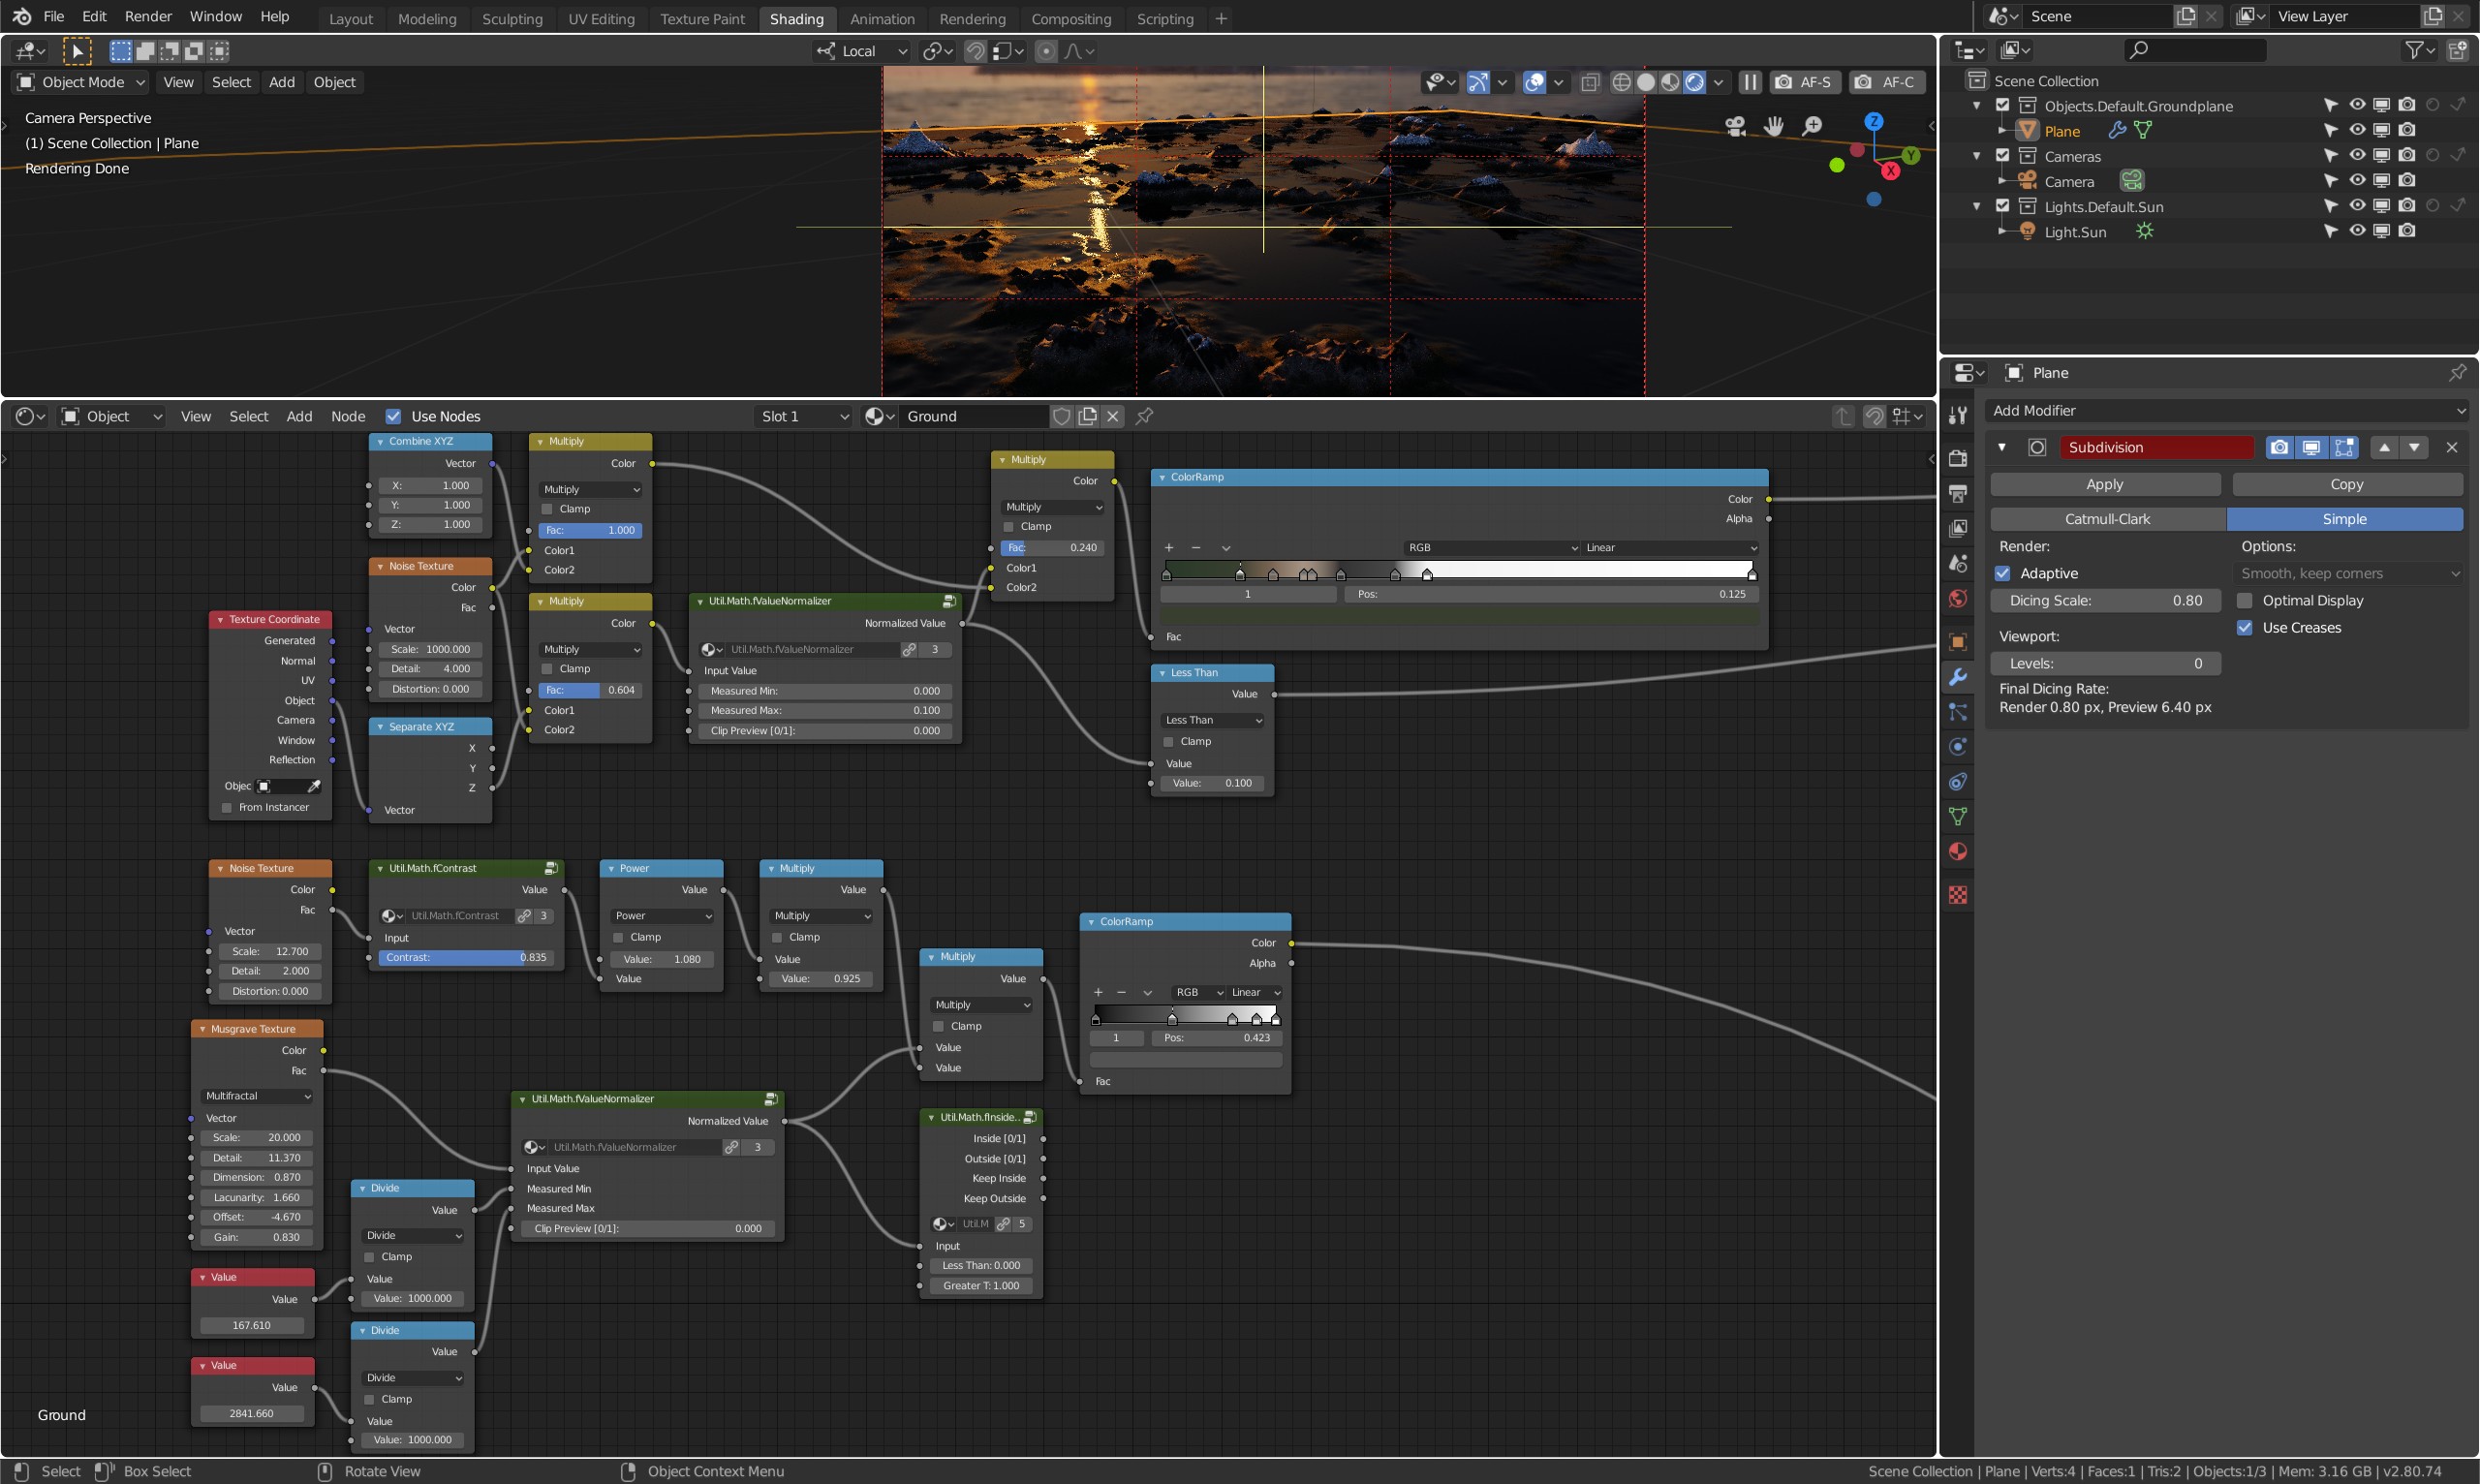
Producing this:

1 face, 1 sunlamp, 1 camera, 1 shader, some comp. Trying to do sea in same mesh was a mistake ![]()
2 Likes
@CarlG Sorry I didn’t get it. The steps you mentioned are steps for one procedure or independent recommendations?
- We sometimes want to keep coordinate numbers outside of 0 and 1
- What is this display device, where to find it?
- What is strip of geo?
- This normalize takes coordinates and cuts range between 0 1 out of them, right?
- You can, off course, but they’ll be harder to manipulate.
- Rendering Tab/Color Management/Display Device.
- Strip of geo for output visualization. This is probably your best bet as I don’t think it clips.
- It takes output from somewhere and rescales it, and you have a preview mode that lets you tweak it so that when you turn off preview all output will be between 0 and 1. I don’t use Clamp anywhere, so it’s not clipped at those values.
You can also F12 render (not viewport render, and we don’t have a “probe object” in Blender) out an image of what you want to examine and right click anywhere on the image to read out the values.
You can also add a temporary math/modulo node if you need to operate and visualize outside 0-1 range, i.e. if doing some trig stuff.
2 Likes