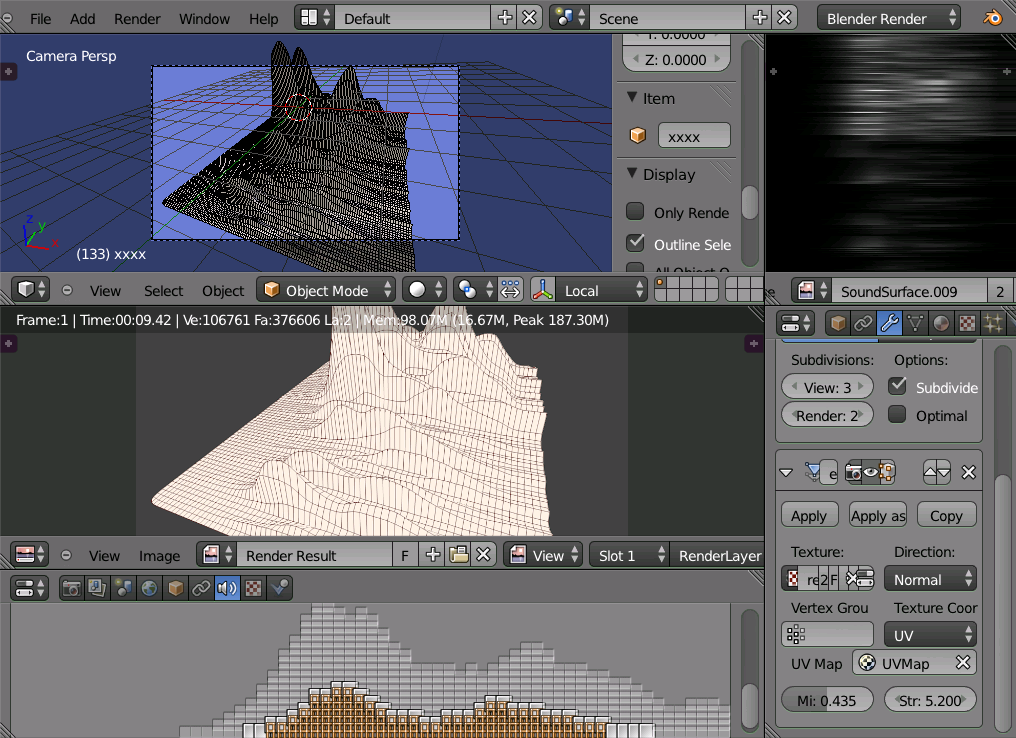
As a visualiser for speaker tools I’ve created a sound surface mapped in y direction to the baked frequency fcurves and in the x by a temp crossing fcurve to create a displacement map. It occurs to me I could also make an rgb normal map by crossing the tangent vector of the two fcurves.
Does anybody know any sneaky tricky ways to find the tangent vector of an fcurve point? Currently I can only think of using a limit to approx the derivate to get the gradient egx
f = frame
dx = 0.00001 #some small number
rise = fcurve.evaluate(f+dx) - fcurve.evaluate(f-dx)
run = 2dx

tangent = rise / run
# get nth derivative of order(len(verts)) bezier curve

def getDerivative(verts, t, nth):
    order = len(verts) - 1 - nth
    QVerts = []
    for i in range(nth):
        if QVerts:
            verts = QVerts
        derivVerts = []
        for i in range(len(verts)-1):
            derivVerts.append(verts[i+1] - verts[i])
        QVerts = derivVerts
    point = mathutils.Vector((0, 0, 0))
    for i, vert in enumerate(QVerts):
        point += binom(order, i) * math.pow(t, i) * math.pow(1-t, order-i) * vert
    deriv = point
    return deriv
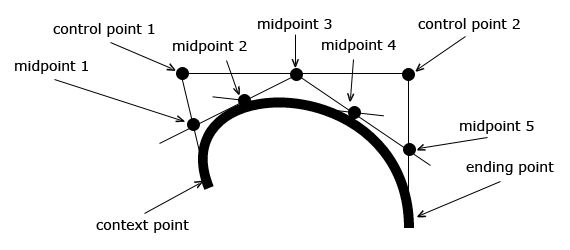
This is just off the top of my head but the fcurves are based on bezier curves. It seems to me that the lines traced between the control points define inherently define tangent lines to the curve.
Thanks for the tips, I’ve gone for the simple approach.
import bpy
from mathutils import Vector

# get the tangent of an fcurve
# use v.yxz for the crossing curves

def tangent_vector(fcurve, frame, df=0.00001):
    v1 = Vector((frame-df, fcurve.evaluate(frame-df),0))
    v2 = Vector((frame+df, fcurve.evaluate(frame+df),0))


    return (v2-v1).normalized()


a = bpy.data.actions['ConeAction']
print(a.name)
fcurve = a.fcurves[0]
vn = tangent_vector(fcurve, 100)
print(vn)
This leads me to my next hassle. I’m going to have to interpolate (probably lerp) to get the tangent vectors for values between each of the sound curves. (baking a sound fcurve for each pixel width of an image == a lifetime.)