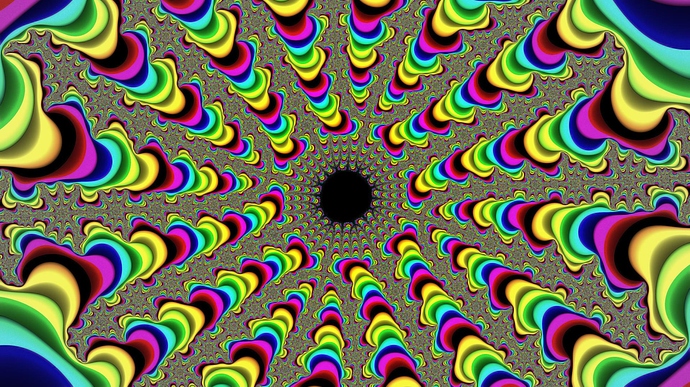
this is a 2d visualization of the Mandelbrot set. I used a blender script I wrote to create the visualization and some photoshop to reduce noise and crop the image.
location on the Mandelbrot set:
scale = 0.000006
x + 0.3665206
y + 0.5913836
iterations = 150
if you want a visually similar image you will have to use a modulo operator for the coloring (iterations % 9). if you simply use iterations for the coloring your image will look almost noting like this. I also used the exit value to fade each color in and out.
