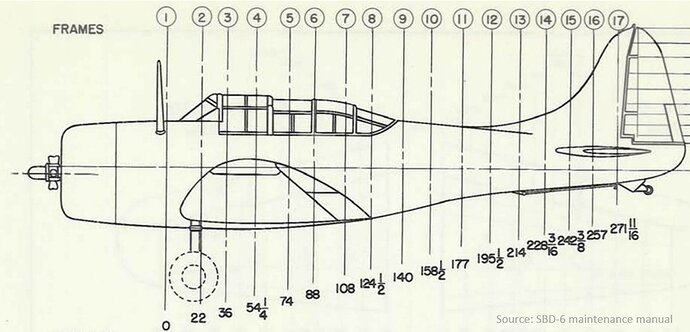
This February I found among the SDASM resources a diagram (dwg no 5060837), which describes the geometry of the SBD fuselage. This is the key piece of the information that was missing in the NASM microfilms I used before. Below you can see these lines:
The original drawing is slightly distorted. I was able to stretch its upper and lower portions, so in the central part its rectangular “grid” fits the blue guide lines drawn in Inkscape. However, this is a non-linear deformation, so it still occurs along the edges of this image. (In the illustration above, I marked these distorted areas in pink.)
The subsequent fuselage frames are placed at following stations:
Fortunately, fuselage diagram contains not only these distorted lines, but also tables of their numerical ordinates. They are provided for equally spaced horizontal and vertical “grid lines”, as in the illustration below:
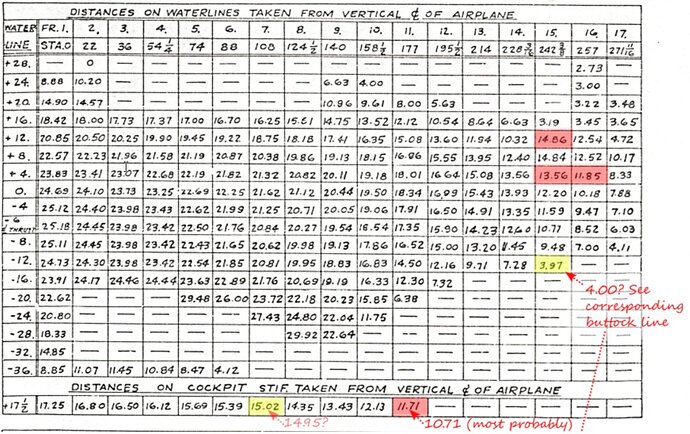
The diagram provides two tables. One of them lists at each frame the fuselage widths along the horizontal lines (“waterlines”). The other provides heights of the upper and lower contour, measured along the vertical lines (“buttocks lines”). For some frames, like Frame 9, the table provides more than two heights, as show in the illustration above.
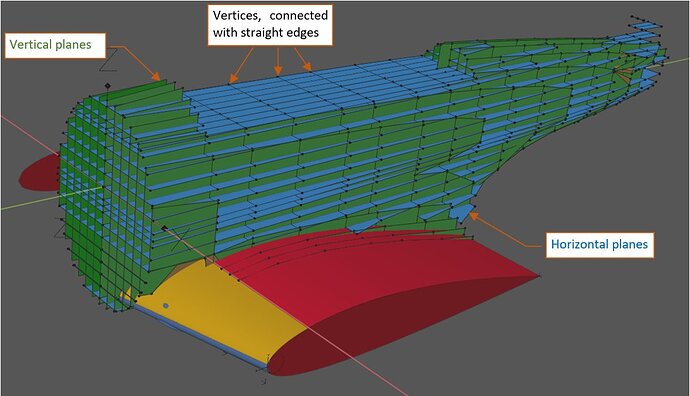
I used these numerical data for building corresponding “contour planes” in Blender 3D space:
Each of these planes is a polygon. Each vertex of these polygons corresponds to a single ordinate. These vertices are connected with straight edges. (On this stage, I did not want to interpolate them with curves.)
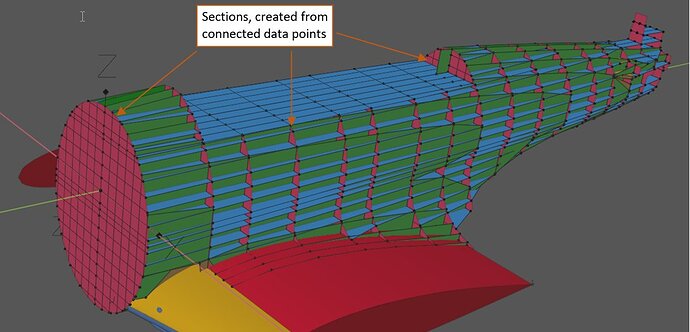
Then I used the same data points for creating section contours:
They are also simple polygons: vertices connected by straight edges. Because I generated them from the cross-sections of the vertical and horizontal planes, you can see on each of them the characteristic “grid” pattern.
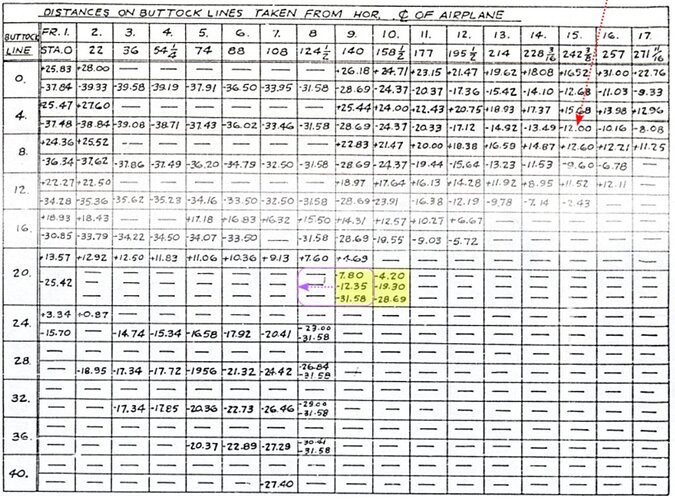
Building these shapes, I found some obviously wrong points in the waterlines. In the table below I marked them in red:
Fortunately, the table of the buttocks ordinates is less erroneous. Just some data points are shifted to a wrong column. (In the figure below, I marked these values in yellow):
There are also others, less visible inaccuracies. In that times all these ordinates were measured from large drawings (some of them were in the 1:1 scale). Still, you cannot avoid minor measurement errors in such a manual drawing.
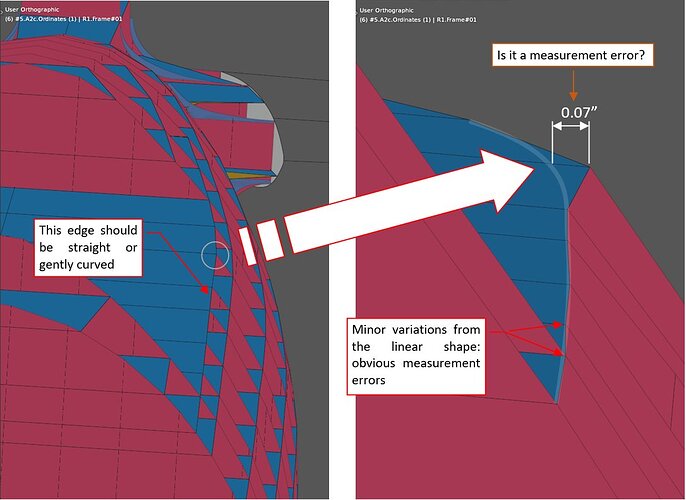
Once I placed these values in the 3D space, I examined resulting lines, looking for irregularities. For example, I found a suspicious point at station 7, on the cockpit frame:
The vertices from the previous frames (1…6) formed around this cockpit edge a polyline which you could extrapolate with a gentle curve. These data points were somewhat dispersed, but no more than by 0.02”. However, the vertex at frame 7 lies about 0.1” from this extrapolated curve. Was it a measurement error, or a real feature of this shape? To determine this, I checked the nearest waterlines (at +16”) and buttocks lines (at 16”). I did not find similar deviation there, thus concluded that this is just an error, and adjusted this outstanding vertex.
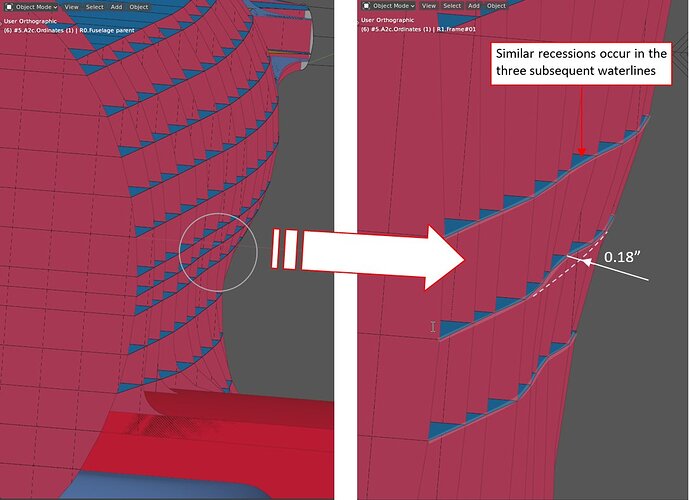
However, when I noticed a recession which repeats in the three subsequent waterlines – I concluded that this is a real feature:
I suspect that this is a “side-effect” of the large fillet between the wing and the fuselage.
There are also differences between the data points plotted according to the numerical ordinates and the fuselage lines depicted near these tables. In the illustration below the plotted lines are in black, while the reference polygons (created according to the numerical data) are in orange:
I suppose that these inaccuracies are mainly caused by the irregular distortions of the scanned blueprint. On the other hand, drawings in this diagram are just illustrations for the numerical ordinates. Thus, you should not treat these black lines as an accurate reference.

