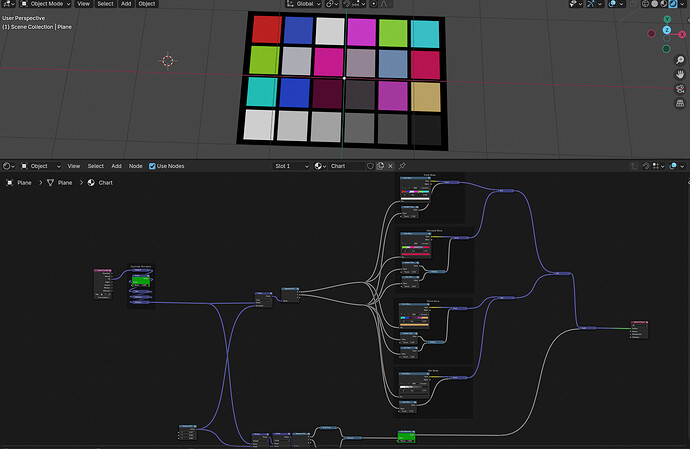
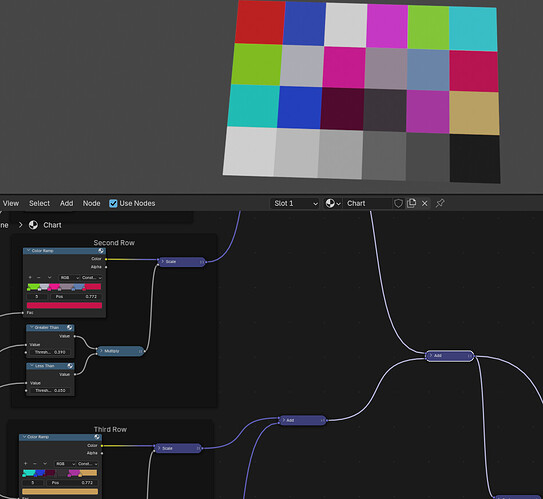
Hello ! That was a fun exercise ! I expanded upon @rigoletto 's idea…
It’s using a single plane with it’s UVs (could use generated coord as well)
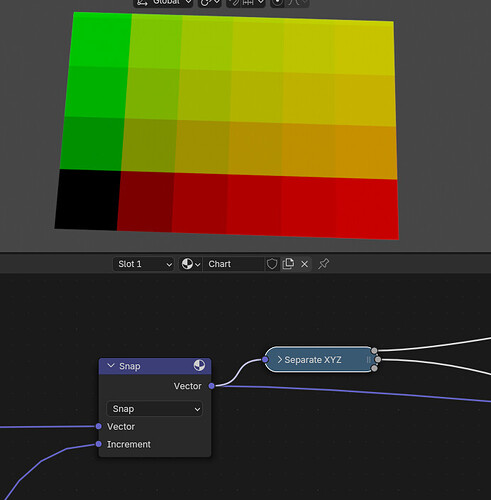
Then we snap the UV to form a grid :
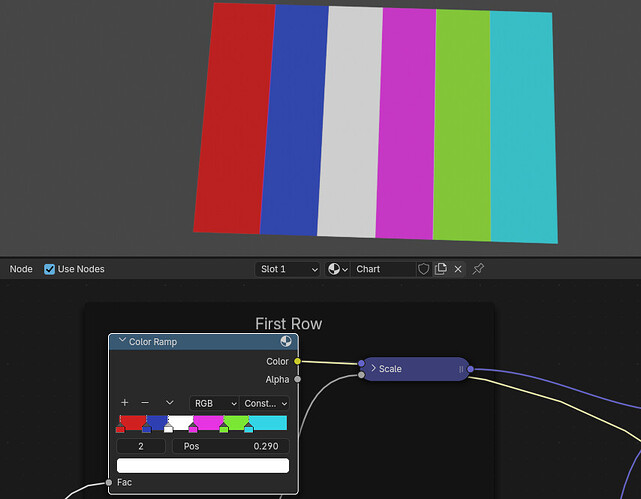
Then we can separate X and Y, remap X to a coloramp :
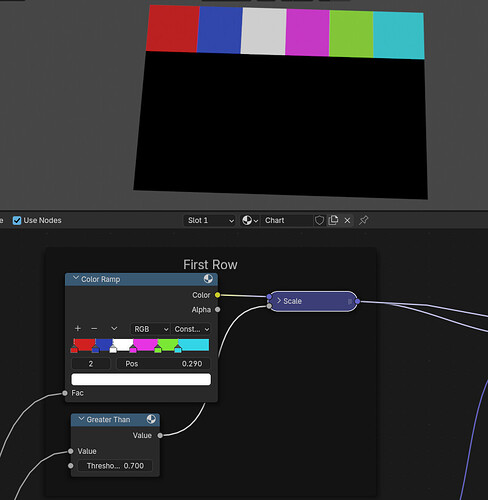
And use Y to isolate the row :
Then add each rows together…
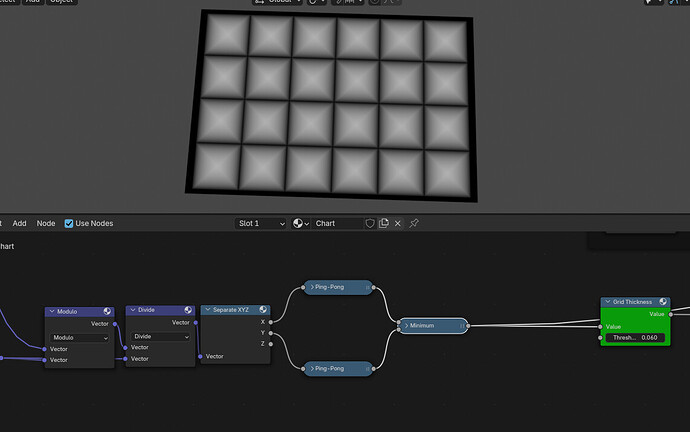
Finally generate this pattern :
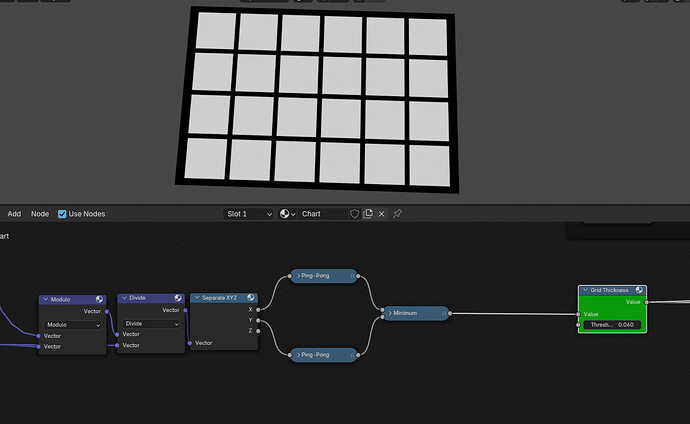
And use a greater than on that to create the borders :
Chart.blend (159.0 KB)
Now it’s just a matter of filling the proper colors and you should be good to go unless someone find an even better method !
