So much better!
IMHO you should provide a 16hours render as ground truth result for better comparisons.
1 Like
Thanks. I did provide a 1080p ground truth render for this scene in this video:

I’ve arrived at 16 hours based on render times generally quadrupling with every doubling of resolution, although I suppose it could be argued with every doubling of resolution you can generally quarter the samples… I daren’t render for 16 hours with the current electricity costs. I’d probably need a second mortgage ![]()
I’m already tempted to plug my PC into a pedal powered generator ![]() …hmm, wonder if they’re a thing
…hmm, wonder if they’re a thing ![]()
1 Like
Hey guys, there was a bug in the Blender daily builds last week that resulted in a Turbo error ‘can’t delete socket from built in node’ when trying to render.
The Blender devs fixed the bug as soon as it was reported, but I’ve just found out that it was accidentally only committed to Blender 3.5 and not 3.4. I’ve just spoken with him and 3.4 daily should be fixed in the next daily build (probably later tonight or tomorrow night). In the meantime, all other version of Blender are fine ![]()
2 Likes
Good news! I don’t know how but it got fixed!! I separated the scene from the project (saved a copy of the project and deleted the scenes I didn’t need on that copy, basically leaving only the one I needed to animate), purged the unused materials and objects, and changed the cache location for that project and for some reason it worked!
Also, I used the “Very High” preset which is not the one I used in the project that was causing me problems (I used “User” preset with 300 samples + noise treshold at 0.100), I don’t know if that has an effect on the fix but I leave it as a note
1 Like
Great news ![]()
For future reference, the only thing that mattered was the cache location and scene name.
When you duplicated the scene, the scene name changed, so the cache couldn’t be found because the cache EXR filenames comprise of ‘sceneName_viewlayerName_frame.EXR’ and then hashed (to convert it into a set length). This is so the you can load that cache into any blend file that has the same scene name and viewlayer name without needing to re-render. Say for example you have project_v1.blend, project_v2, projectFinal, projectFinalFinal, projectFinalFinalAbsolteFinal, damnedClientWantsMeToStartAgain.blend, etc, they’ll all be able to load in the correct cache (providing the cache folder is set to what it was when you rendered, and the scene and viewlayer names match).
Having a different cache name per scene and viewlayer also means you can have several scenes and viewlayers per scene in one blend file, and they’ll all get their own unique cache, so that they can be automatically loaded for the appropriate render layer node (when combining several scenes in one compositor for example).
ps, if you ever want to try out different variations of the same scene, to avoid overwriting the cache for the other versions, you can just set a different cache folder every time you render a different version. You can then reload the cache you want just by setting the cache folder to the ones you want to see, and then pressing refresh all.
If ever you get an error, it’s always because Blender has failed to launch queued python functions once it returns back to the main thread after rendering. It should be quite rare now as I’ve added lots of code to check, and Blender 3.3 and above has also had new functionality that helps too. Just to be safe though, I’d always recommend checking the compositor directly after rendering or publishing, just to make sure the node tree has been returned to the correct state, and if not, you can just press ctrl Z a couple of times, and then press refresh all. That’ll revert to the correct state, and refresh all will load in the cache just created from the render.
![]()
1 Like
Another thing that might be useful to know. If you don’t need the cache to be generated for all frames, say for example you’re only interested in the output blender generates (ffmpg, jpg, png, etc). Then you can disable the caching system completely by disabling the animation option at the top of the turbo tools panel in the compositor. It’ll still generate the cache during rendering, but after every frame it will then delete all but the most recently rendered frame.
When you do that, if you’ve already rendered some cache out that you do want to keep, make sure to change the scene cache folder, otherwise it’ll be overwritten during rendering, and then deleted.
At the end of rendering you’ll be left with just the most recent render layer cache EXR, so that you can still take advantage of all the turbo comp functions available in the turbo comp panel.
1 Like
It’s all in the manual anyway, but good to put it here too.
Here’s a couple of videos showing some of that and other useful tips too:


I got around to having a good look at the video and compared it to my own local render.
Now I’m sure Youtube compression partly doesn’t help, but on looking at the same area’s you zoom in on the video, I think even the 2min ‘high high’ render misses the mark in a few places, assuming that one is really pixel peeking.
Here’s my render of the scene:

Using Blender 3.3.1, with the same 800 samples and denoising with a RTX 3080 Ti and hence just under a minute render time.
I think you used a alpha version of Blender for the video, so I wonder if that maybe wasn’t the best idea. Even so, if you look at that same shadow line on the bench top half way down on the left side and it seems to be even sharper then the best TT3 render.
I do note that the textures are not as ‘detailed’ in my render, but I wonder if it’s possible that TT3 was maybe pushing the contrast more and hence making those textures ‘pop’ more then they really should.
What makes me think this is the wood chest of draws on the right side near the door that you point out in the video. While the front side (with all the light) doesn’t look as detailed, the side in the shadow does look pretty good. But what stands out more is if you look at the heater radiator right next to the door just behind it and how it shows more object detail compared to the video, as does the bottom panel on the door.
Now sure, one has to look pretty hard and my render time is only half that of the 1070, if I was to use Turbo Tools on a 3080 Ti then chances are the computer would spend more time building the scene generally then actual rendering, but in some ways this goes back to my early post, of directly comparing production output and what it takes to get the same result and how much faster one can achieve that.
It would be very interesting to see just a still image comparison and how long the render takes to match the ‘original’.
1 Like
thanks for the suggestion ![]()
I think the biggest thing I notice in your render is the loss of texture detail on the marble and also the chair seat on the right hand side. Possibly the floor, sofa and tiles are quite lacking in tetail too, and the toolbox.
The shadow on the left is a little sharper on yours. With turbo render you would have reduced your render time by around 3 to 4 times to get the same result I’d guess, as like you say, I think I could have done with a little longer to get the same result on the shadow and glossy. Still, pretty close for 5x faster. The result I got would be achieved on your card in 5x faster than whatever you currently got ![]()
Oh and you’re right. Turbo can enhance the textures a little, most people prefer this as it tends to add a bit of realism, and obviously it’s much better than them being smoothed away, as is usually the case with the inbuilt denoisers in the render panels. On rare occasions I do find some textures can be too strong, in this case I just reduce the contrast a little in the texture prior to rendering ![]()
True, which would happen if someone is using too low a number of samples, leaving the denoiser little choice but to ‘blur’ stuff more. So the fact your tool keep the detail with low samples is an achievement and then just comes down to ‘artistic’ choice of how detailed/enhanced one wants the result to be.
1 Like
A sale seemed a good time to question less and just try it out myself, so I am.
A lot to test and play with so like anything, it takes a little time to get the best results. Still, so far it’s done pretty good.
Here’s the exact same Barbershop scene as per my post above, only this time rendered using Turbo Tools 3:
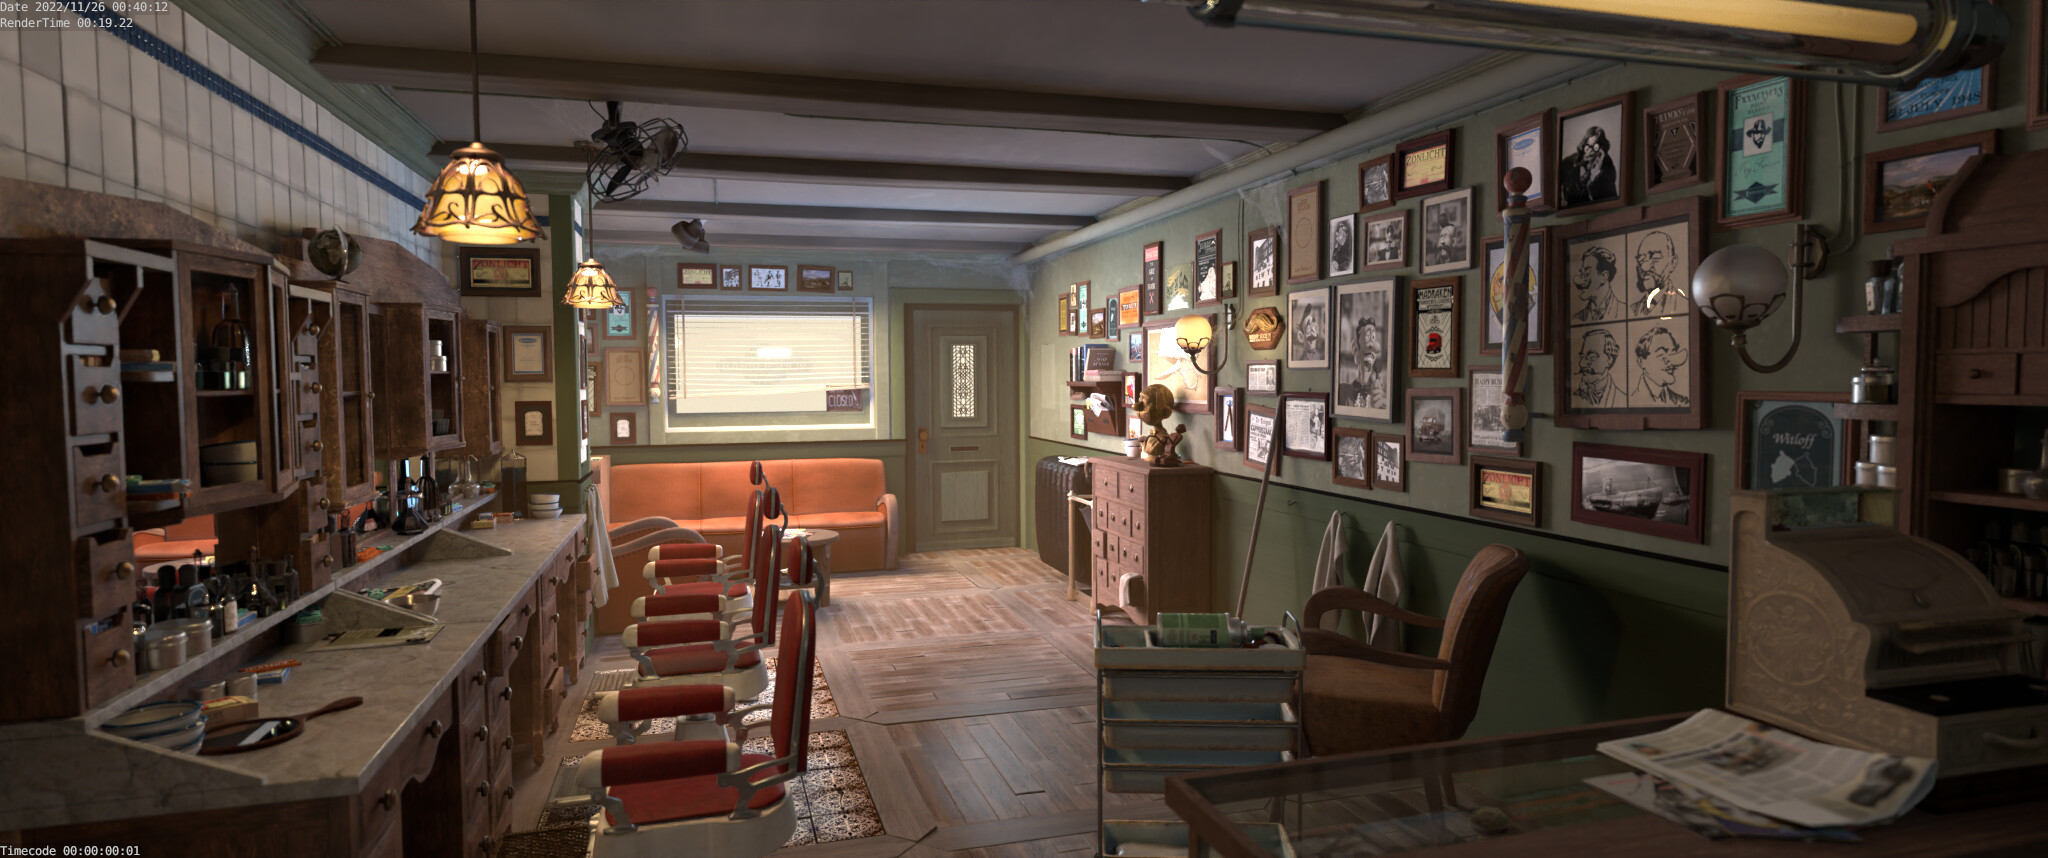
If one downloads both and flicks between, there are a few differences, tho in most cases the TT3 render is actually better. There does seem to be the odd spot of highlights on glass surfaces missing and the knobs on the top two drawers at the very left of the image have a bit of a halo around them that I can’t get rid of.
Other then that the overall image seems a little sharper and more texture detail and of course it rendered 3X faster on the exact same hardware.
Keep in mind the render time can likely be decreased even more, but I’ve only just started using the tool and my goal was for matching or better quality, not to try and render it as fast as I can while still getting an acceptable image.
Basic upshot, I can now render way faster then a 4090, for way way way cheaper then a 4090.
2 Likes
Thanks Tony. Glad to hear it’s bumped your card above a 4090 ![]()
The halo is probably caused by the heavy dof needing to be turned on, or if you’re using the ultra denoise mode, then it requires a higher sample preset than the other modes (chart on the product page giving a rough estimate of min sample presets to use for each denoise mode). Alternatively turning on the interior mode will increase the min samples to avoid cycles terminating sampling too early. I’d generally recommend using the high or lower denoise modes unless you need access to the individually denoised passes in post, that way you’ll be able to use even lower samples ![]()
I’m using High|High presets with all surfaces checked and all Enhanced checked and already had Interior mode checked.
Turning on Heavy DOF seemed to help a little, but the halo’s are still there. Well, when I say still there, one has to zoom in and its only the very top two knobs so not easily noticeable, but still there compared to the original, which has none.
Its almost like something one would see if you used an edge sharpen filter in Photoshop, where it tries to add extra contrast around the edges in an attempt to make things ‘pop’ more.
do you have enhance glossy and transmission checked?
I’m guessing so. I might have to remove those or rename them. They should virtually never be used. They’re only meant to be used if the glossy or transmission is driven by a very detailed texture, like an intricate stained glass window for example. They’re basically for preserving the texture data, but if there isn’t a texture then it can lead to slight edge artefacts without much higher samples. Just use the preserve texture and you should be good ![]()
They can be thought of as:
Enhance diffuse texture
Enhance glossy texture
Enhance transmission texture
Yes I do, or should I say, yes I did.
Just unchecked them and rendered again and the halo’s are gone.
1 Like
Yeah, I’ll rename those options or maybe remove them.
Turning them off actually fixed up a couple of other minor issues with shadow lines not being as sharp. It did make the render take about 1s longer, but now the result is even a better match to the original and still more or less 3X faster.
I did leave Heavy DOF on however, along with just enhanced texture.
Awesome! Yeah the more things that are visible to camera the more time the denoise phase takes. So it’s best to only tick the things that are definitely in the scene, and if the environment is only visible through glass, then check that option too to reduce time further ![]()