I finally managet to put it all together.
Blender 2.74. Create graphic Bar in Belnder 3D using Python an CSV data file
The code that you put in Script Page in Blender in in atcahement.
Is a mixture of english ans Spanish, but it works fine.
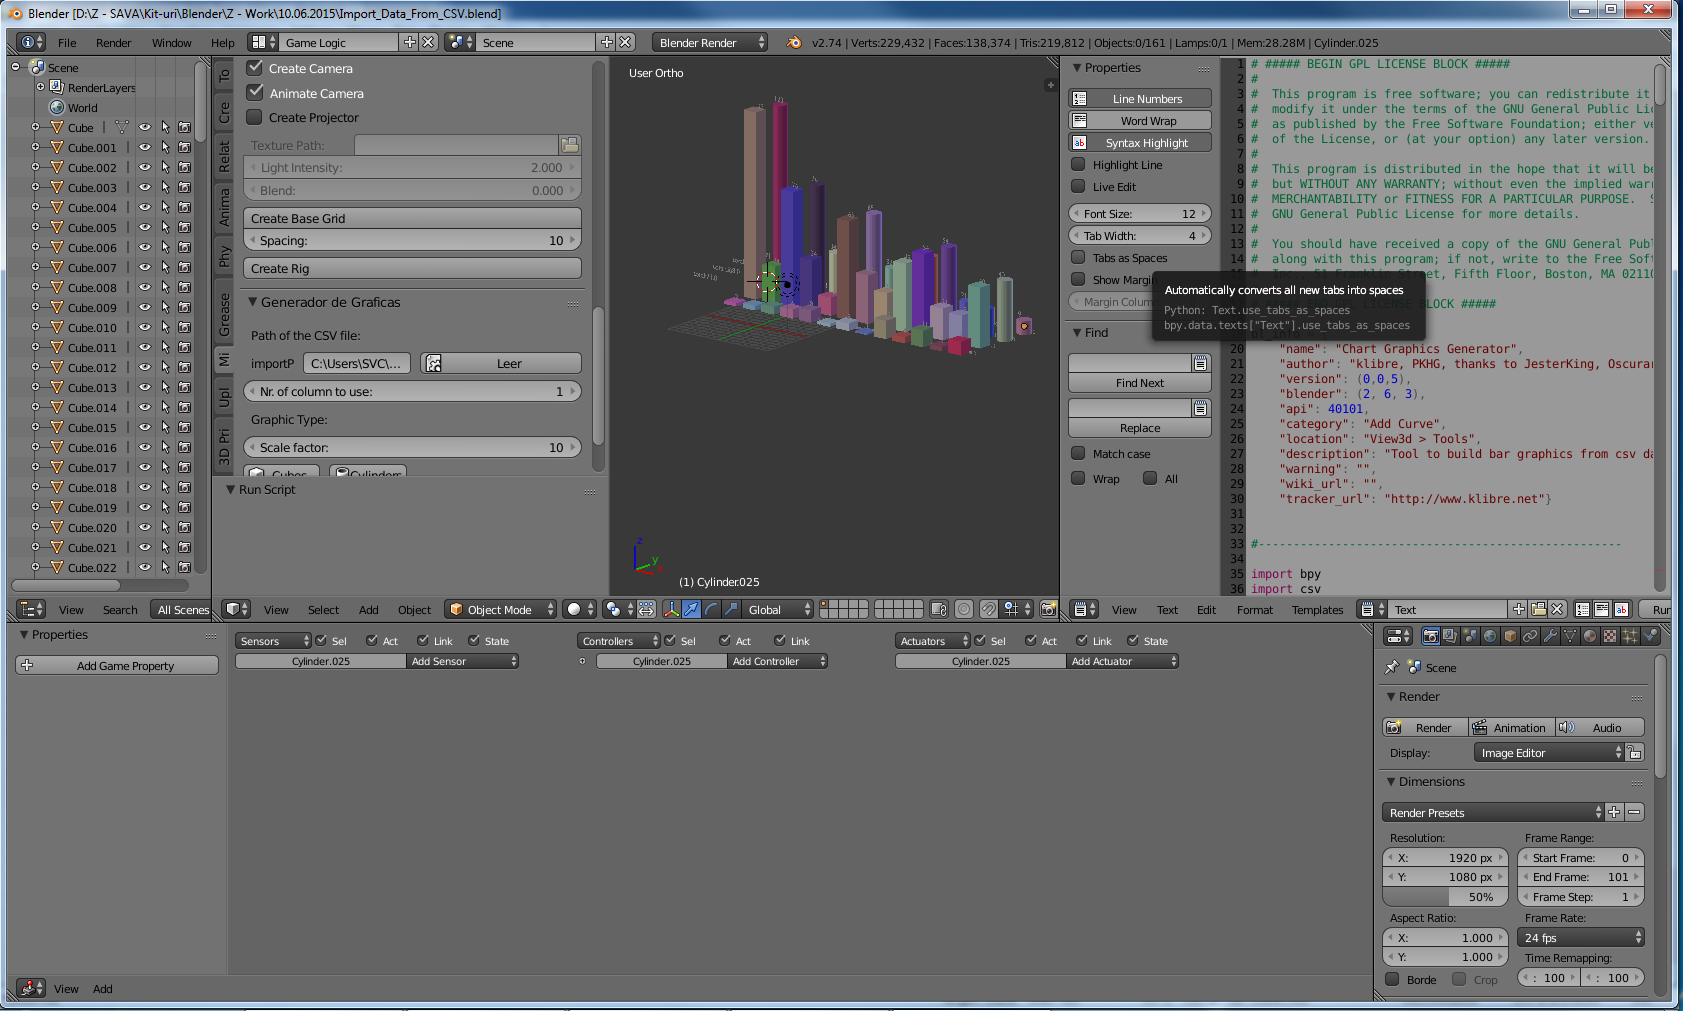
Look in the properties tab from script, as in image atached, and deselect Tabs and Spaces.
Now hit Run Script!
Then in the image section in blender hit T key from the keyboard, go to Mi, as shown in image atached,
put the path of the CSV file, hit read file, select for wich column you want to create graph, then hit cube or cilinder.
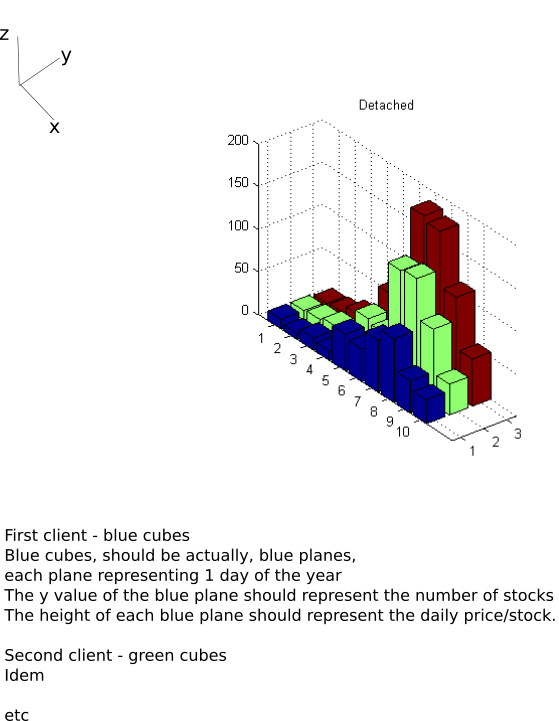
Here is a sample for CVS file :
Client1,2,123
Client2,3,24
Client3,5,76
Client4,6,34
Client5,8,12
Client6,2,65
Client6,5,32
Client7,1,23
Client8,12,45
Client9,4,54
Client10,11,21
Client11,3,19
Client12,9,40
Import_Data_From_CSV.blend (1.15 MB)