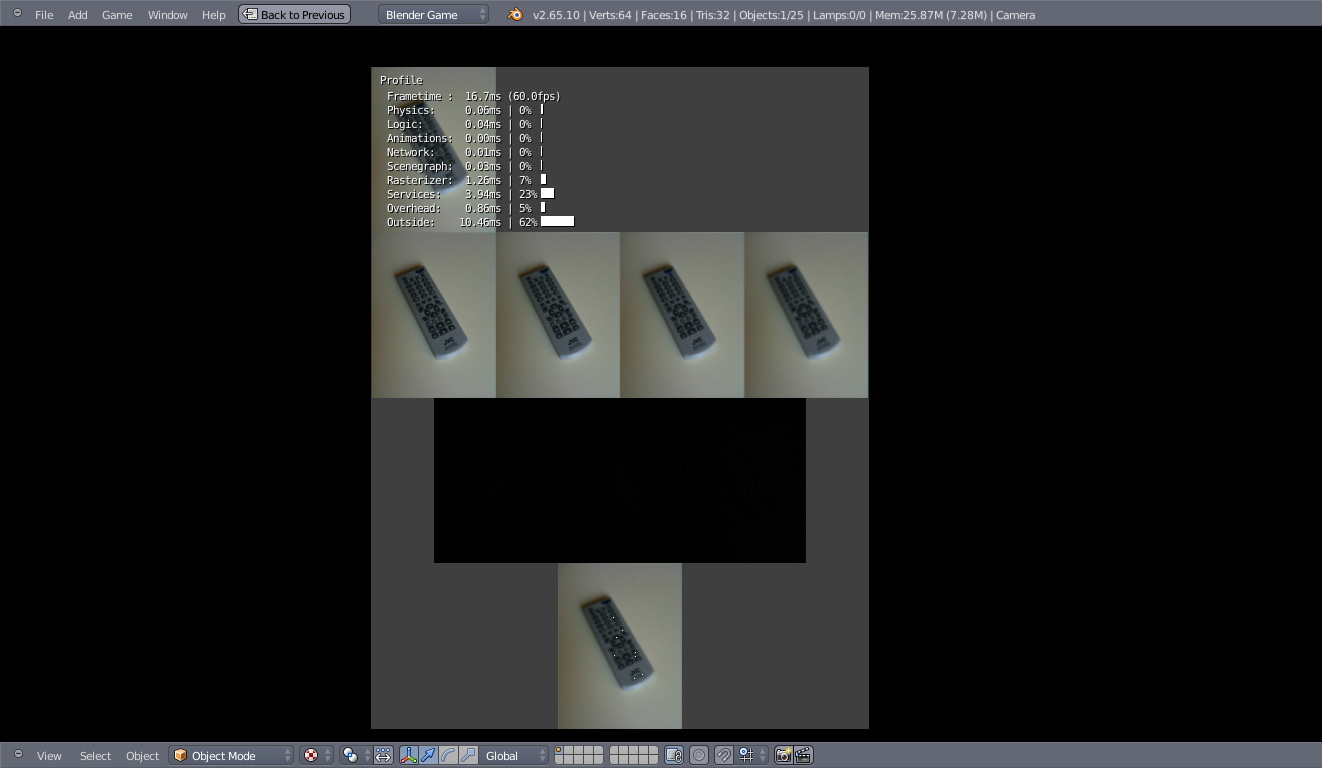
I did some GLSL coding. The strange thing is the bge-profiler. When I have the “Use Frame Rate” option set then most time is spend “Outside” and just about 1.25ms inside the rasterizer. Disabling the option I get 13ms inside the rasterizer. In the end I have around 60 fps for both variants. But from the logic mind I would say that if the rasterizer just needs 1.25ms to finally end up with 60 fps shouldn’t I get much more fps without the frame rate limiter?
VSync is off in amdcccle.
Blender-version is: r54314, used a daily build of blender.org
Here is the blend + code: https://docs.google.com/file/d/0B-DgjzoFZxxwcmowWHJEaFZleDA/edit?usp=sharing

When you use the limiter, the values in the framerate tab are all false.With no limits,your pc runs at maximum capacity, and in many cases the Rasterizer uses the most power. It shows where exactly the most resources are used in…
Imagine this, you have 3 bags and lots of $, you want to fill only 1 bag with the $ ,but since the bag is limited , you will have fill the others too. It is not the best example…but just an idea…
False values. That would explain a lot.
But then wouldn’t it be nice to e.g. hide the profiler when the limiter is on? E.g. profiler-option is disabled when “Use Frame Rate” is on. Just to stop the confusion.
Usually you would not run a game without timed synchronization. The games speed would vary from hardware to hardware making it harder or easier to play (like the real old i8080 games).
I did a little hack to hide the profiling when “Use Frame Rate” is enabled:
Index: source/gameengine/BlenderRoutines/BL_KetsjiEmbedStart.cpp
===================================================================
--- source/gameengine/BlenderRoutines/BL_KetsjiEmbedStart.cpp   (Revision 54687)
+++ source/gameengine/BlenderRoutines/BL_KetsjiEmbedStart.cpp   (Arbeitskopie)
@@ -316,7 +316,8 @@
                ketsjiengine->SetRenderTools(rendertools);
                ketsjiengine->SetRasterizer(rasterizer);
                ketsjiengine->SetUseFixedTime(usefixed);
-               ketsjiengine->SetTimingDisplay(frameRate, profile, properties);
+
+               ketsjiengine->SetTimingDisplay(frameRate, usefixed?profile:false, properties);
                ketsjiengine->SetRestrictAnimationFPS(restrictAnimFPS);
                KX_KetsjiEngine::SetExitKey(ConvertKeyCode(startscene->gm.exitkey));
I would suggest to split the options for “Show FPS” and “Show Profile”. That way the profile could be turned gray if “Use Frame Rate” is set.
@Monster I don’t quite understand what you want to say with that regarding the differences in the profile views.
Yeah. Timed synchonization. Not FPS based.
E.g. with s = v * t you will have to make t dependend on the time taken from last calculation to this one so you’ll move virtually the same distance independend of having a fast or slow machine.
The problem is with the profiler:
Having 60 FPS, so 16.667ms per frame, the rasterizer takes about 1.26ms.
Having 67.5 FPS, so 14.815ms per frame, the rasterizer takes about 13.1ms.
Independent of the FPS the time taken by the rasterizer per frame should be the same. If you could say to your GPU “render this slowly, take your time” then the result should be the other way round. Right?
So that’s way I guess that BlendingBGE is right when he says that the profile-values are wrong when using the limiter.
I think Monster’s point was more that you would never disable frame-rate locking for normal games, since that would make the game logic (at least) run more often / faster (so if you manually moved anything without using the Bullet physics engine, it would move much faster, for example). The physics also speeds up if frame-rate isn’t limited, which is because it’s still using the target FPS value (logic tic rate when set with Python, I believe), not the frame-rate of the game.
Anyway, I think it would be a very bad idea to disable the profiler if the game is FPS-locked. Even if it’s inaccurate, the information is still vastly useful. When your game has very little in it, it will run at 60 FPS with nothing pulling on the CPU / GPU, but when it’s complex in the physics, logic, or rasterizer departments, the profiler will reflect that. Even if the profiler is incorrect, you can still refer to it and optimize your game accordingly.
I think SolarLune got the point.
I want to give you an example: we used to play a game - i cant remember the name. It was about flying a spaceshuttle along a track with walls and other obstacles. It was written for i8086 processor (4MHz). We played with i80286 (20Mhz). The game has no time synchronization. The result was that it run that fast, thst we could not even avoid the first wall = game over.
What we did may sound silly. We wrote a simple program that run parallel und did nothing else than wasting processing time by countng silly numbers. That slwed down the game speed that we were able to play it.
Just a short story from the time shortly after the FAX machine ;).
Actually time difference does a affect game play. Whilst generally speaking the physics runs at the same real time, you would need to increase the world steps to make sure that it can keep up with real time. Also logic would be far more responsive with a faster frame rate and that is one of the biggest issues especially when using loc displacement in the motion actuator.
Simple dLoc movement without deltaTime consideration shouldn’t be done in real games.
Please don’t assume that all people are playing at 60Hz (or even worse: 30Hz) or just cap them there.
People already figured out how to use deltatime to be independent of the frametime. (http://en.wikipedia.org/wiki/Delta_timing)
So please don’t fall back in simplicity
http://kahrstrom.com/gamephysics/2011/08/03/euler-vs-verlet/
http://www.niksula.hut.fi/~hkankaan/Homepages/gravity.html
Bullet considers this.
Just because you have more frames per second doesn’t make dynamic objects e.g. faster. The act “better” because bullet can do better and more math on them.
It’s like drawing y=x². You can draw it for x=-3,-2,-1,0,1,2,3 or finer steps like x= -3, -2.5, -2, -1.5, … or finer x= -3, -2.999, -2.998, …
The more steps you have the smoother and correcter it will be.
Capping the framerate at some point isn’t bad. You want to save energy via “less processing means less power”. Or your output device might just be able to able to show e.g. 60fps. (Here is just the problem that you probably won’t get in sync with your device. People can feel a difference here with higher framerates. Just ask those Quake and CS people.)[John Carmack also talked a bit about sync: http://superuser.com/questions/419070/transatlantic-ping-faster-than-sending-a-pixel-to-the-screen/419167#419167]
OK. That is that.
Still the problem is: the profiler gives totally wrong values with frameratelock.
If I wouldn’t have checked without lock first I would have thought that my code especially the GLSL part is awesome so far. Most time is taken somewhere outside. Not bothering me. And some service which should be according to https://mogurijin.wordpress.com/2012/01/03/bge-profile-stats-and-what-they-mean/ just being some device checking. With 4ms a bit high for some thing that isn’t included in that project…
Profiling is nice. And it would be even nicer with e.g. cprofile integrated.
But seeing false values isn’t nice.
So first priority should be to fix that. But as long as that isn’t done the profiling values shouldn’t be shown because people trust those values. And trusting wrong things isn’t good. They might start fixing things that aren’t broken and break something.
Just my thoughts on that.
Thanks for the answers, stories, and clarifications!