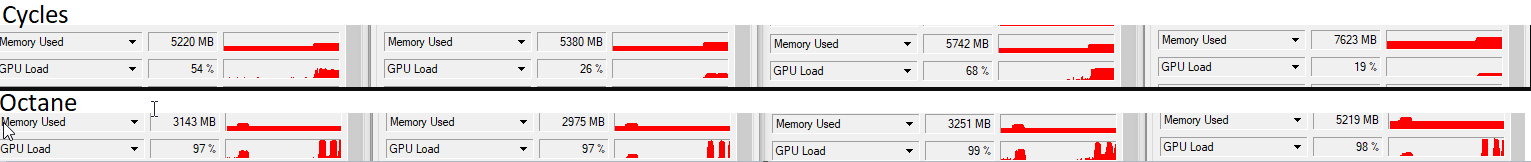
Hi, I’m coming from Octane render and decided to give Cycles a go. I instantly noticed that the viewport rendering felt slow and sluggish compared to what I’m used to in Octane. Checked GPU load in GPUZ and noticed only one card is being utilized at about 85% load, 2nd card at around 70%, and the other two are barely hitting 20% each. Hit F12 to do a final render and all cards shot up to full load as expected.
Anyone know why viewport render isn’t utilizing all cards? I’m on 2.81 if that helps.
Edit: I switched F12 final render to use progressive instead of tiled and it severely underutilizes the gpu’s just like viewport. So turns out this isn’t about the viewport so much as about the progressive render engine playing poorly with multi-gpu.
Edit 2: Did more tests from version 2.79b through 2.83a. Identical results across the board.
thought it was just a AMD issue… i had (well still ahve but took them otu of the system) few VEGA cards, and was unable to get full utilization in windows 10.
So this being an across the board issue, migth need to reprot a bug to the Blender Dev team that multi GPU is not being properly utilized.
Still to confirm, outside of the “utilization” in GPUz
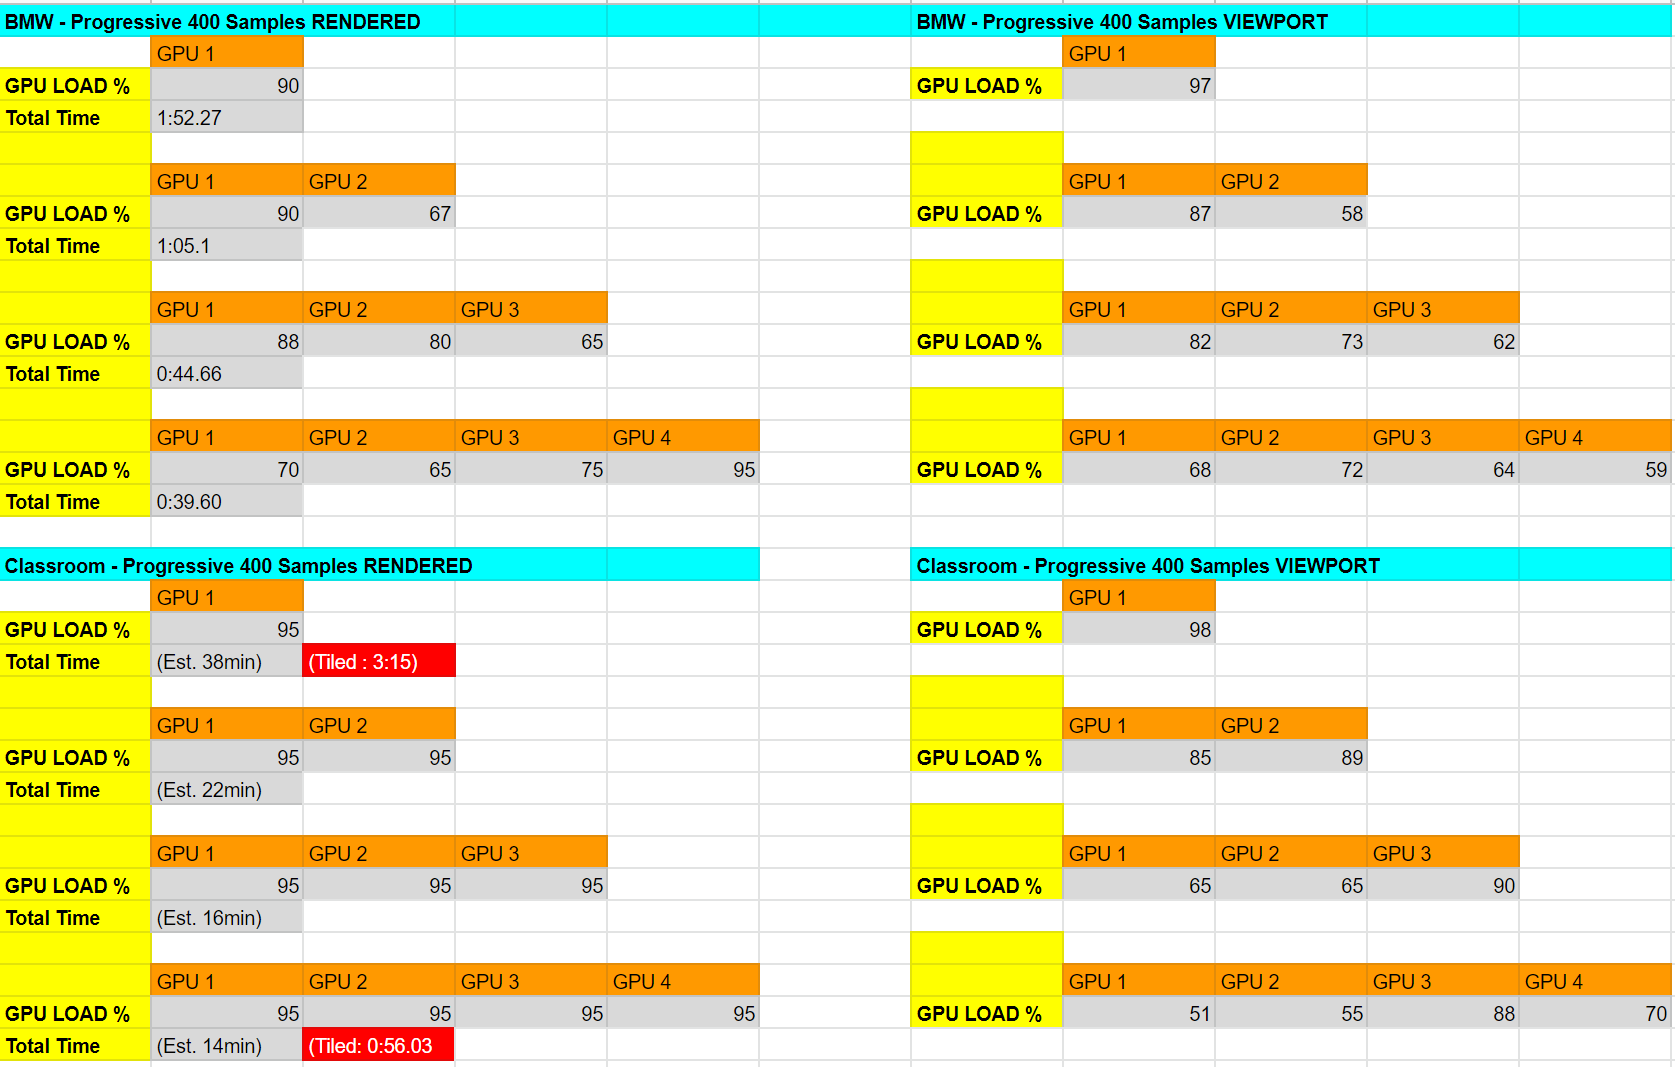
Can you test eitehr BMW or CLassroom scene with 1, 2, 3 and 4 GPU’s to see if there is the "proper’ scaling. Migth be that the “utilizaiton” is not being displayed correctly.
For me, I definitley confirmed a regression in multi GPU setup, but again I have WIndows 10 and AMD GPu’s
I reported it as a bug about an hour ago. I’m 99% certain it’s not a GPUz visual error. Viewport render was significantly slower and generally sluggish compared to Octane render which prompted me to investigate. Additionally, my card fans shoot up to full RPM’s when rendering in Octane, yet they don’t do this with Cycles unless I do tile rendering.
Downloading the Blender Benchmarks now to give it a test as you suggested.
FYI, personally I am not experincing such a thing.
2x2070 Linux. So at least not confirmed there. But yeah might be a problem under Windows.
You might want to add that to the report.
Oh, shoot! Didn’t even notice the viewport part. Of course your right. Late here, gotta get to bed…
Edit: Ahhh, no wait… are we talking about the actual Cycles viewport render or OpenGL viewport?
Edit 2: This kept me from bed. Fired up the machine again and can confirm unconfirmed. Both cards are between 98 and 100 % all the time in rendered viewport mode. Tested with classroom.
All benchmarks had the GPU load jump around a lot. BMW was jumping 5-10% while classroom was jumping by 50%! I eyeballed the “average” by using the highs rather than lows. For example, I have classroom listed at 95% yet every few seconds it would drop to around 40% across all cards.
Classroom benchmark was extremely weird. Progression F12 render was 15x slower than tiled. I watched the sample counts slowly rise. However, viewport render was significantly faster than progressive F12. I have no idea how this is possible.
For comparison, I rendered a couple scenes that already had materials converted for Octane (Neither of these benches were converted), the GPU load never once fell below 97% for any of the cards.
We got a response on the bug tracking. Looks like it’s not a bug but a known limitation. At least it’s confirmation that I’m not going crazy. Unfortunately, doesn’t look like there’s an eta on when it will be optimized.