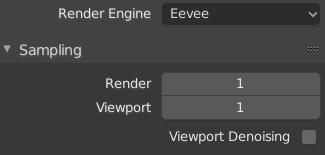
I’ve put samples at 1 and no denoising, so why is my rendered animation taking ages?
How can I troubleshoot this?
I’m using 2.80 release and outputting 1080p to high quality h264.
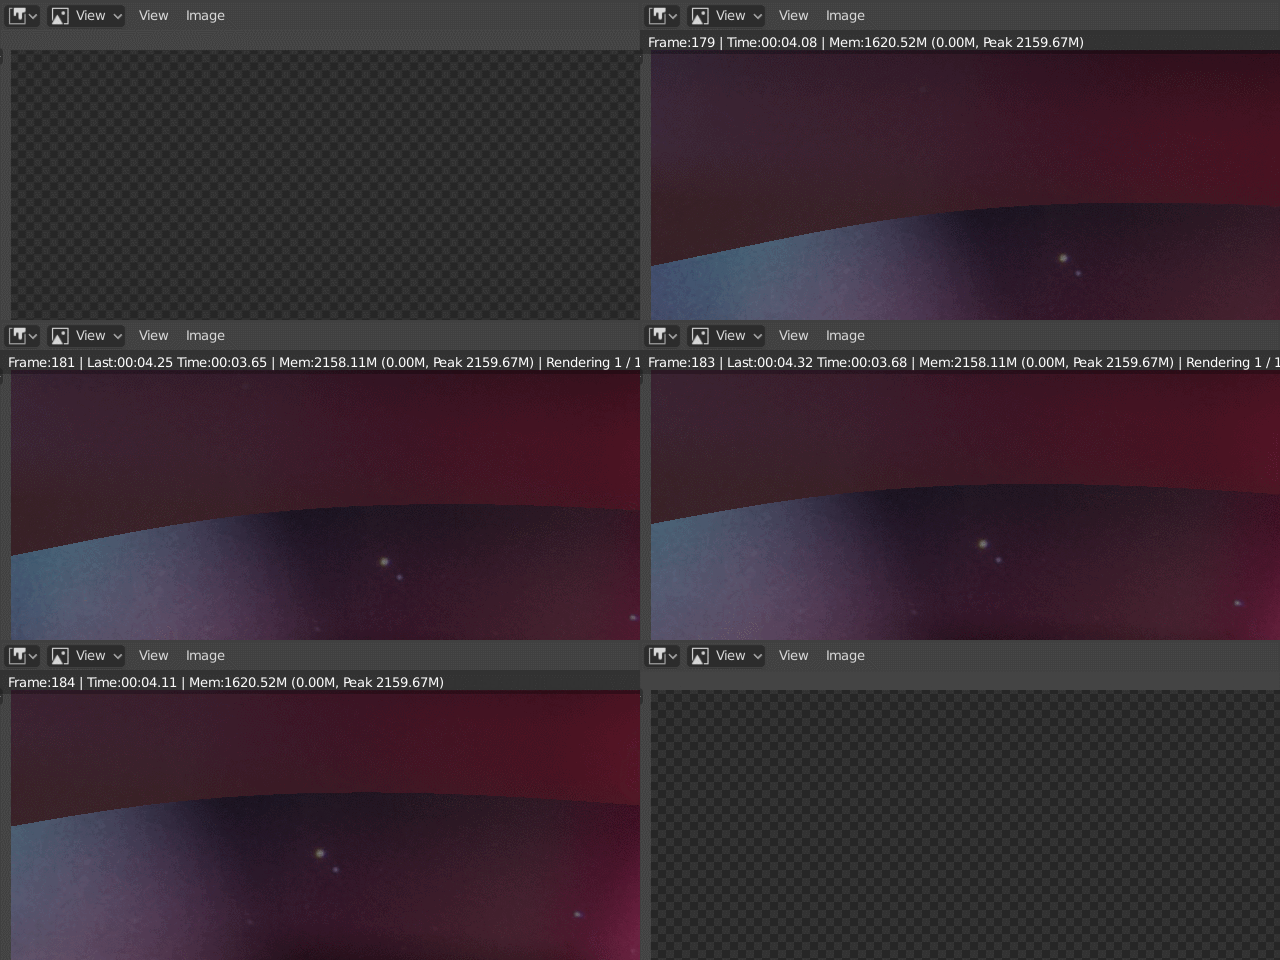
The Blender Render window also often just shows a checkerboard instead of the current frame and timing information. The experience is like I’m using a super, early beta software.
That was a question at the Blender conference during the “ask the developers” thingy.
It is something like this:
When displaying it on the screen the gpu pushes it straight to the screen which is very fast. But because of some technical mumbojumbo when saving an image to file the gpu has to push it to the cpu first.
Apparently it is impossible to do it differently beause of how GPUs work.
I can not remember the specifics but if you are interested you can check the following Link. I am pretty sure it was answered by Jeroen Bakker:
Anyway 30 fps vs 0.01 fps seems like a lot of difference. Can you measure GPU vRAM usage with external vRAM monitor app when you make final render? With Eevee, out of vRAM results in very excessive render times.
Can you share the scene with packed textures?
No idea. That’s what the developer said. I can only guess. Perhaps unreal rips the image from the screen which is faster for some reason? EEVEE can obiously not do that because then you could not render resolutions larger than your monitor.
Regardless of your render output size in Unreal, the view render happens in a tiny window.
I get the prolonged time if I wanted render layers or cryptomatte, but since I’m outputting straight to a movie file with compression, none of that matters.
I’ve heard about this thing and for me it is 100% (1000% ^^ ) bullshit
(Not against you, @Lumpengnom, don’t worry . I’m really speaking about this rumor)
CPU Compressing and Saving a full HD file (jpg or even png) is about a millisecond, and exchanging the data from GPU to CPU, is way WAY under a single millisecond.
And any way, even a basic OpenGL renderer can render and save fullHD files @ 100 fps, so it’s 100% sure it not a file saving issue, like AT ALL.
To come back to your problem @eobet , indeed there are a lot of differences between viewport and render. Like @YAFU said ther is this bit depth thing, but also others.
The problem is pretty much the same with Cycles, by the way :
When you go Viewport rendering, you have ONE single BVH construct, and ONE single Texture sending to GPU, and then you are “Real Time”, I mean, each time you move an object or camera, the render fall down to 1 sample, but starts the compute (ray casting) INSTANTLY. Whereas when you render the animation, on EACH frame, you get the BVH construct + Texture Loading of ALL FILES textures in the scene, and that’s pretty crazy, I agree.
To sum it up, it’s pretty much a developpement optimisation issue. Like in earlier 2.7 Cycles, there were this discussion about Static BVH, and Dynamic BVH, and then the option disappeared because choice have been made to go Static Only (meaning Whole BVH construct done from zero on each frame).
Maybe it’s just too early to get an optimized GPU pipeline for rendering animations… Let’s be patient, future will be better
Thank’s for the timecode I couldn’t find it
So, he says copying from GPU to CPU it not faster than 20 FPS. Even if I think it can be much faster, he is basically saying that the “copy” thing is 1000/20 = 50 ms.
So obviously that is not the issue @eobet is having (like a lot of others). Adding 0.05 seconds of delay is not the reason why the total render time is about 4 seconds
Then perhaps it is the samples thingy. I am not sure which samples he means becaus in the EEVEE settings you can set Render and Viewport samplings and he says that the samples are hard coded to 1 in viewport and 64 in render. I guess there are some other samples.
Edit: Ah, never mind. You mentioned that in your post above.
Yeah it’s the same. It’s just when you are animating. If every thing is still, the Viewport Sample are considered (if set to 64 it will go progressively from 1 to 64)
Whereas if animation if launched, it’s not waiting for computed sample to be 64. As soon as sample compute reachs 1, it computes denoise if enabled, and directly switches to next frame
These were my sampling settings from the real-time GIF I posted above:
I can’t show this project publicly, but I really want to throw it into Unreal Engine and render it out just to compare. Unreal is what I thought Eevee was going to be.
Same here, just rendered out a 4mn film in Eevee and it took the night, whereas it plays at 17fps on my machine. It’s really annoying, and I’m sure it can be fixed (talking out of my ass again, only with great confidence).
That is why Clément recommended a GPU with as much vRAM as possible.
By the way, it would be good that users share the scenes where they are having problems so that the causes of this problem are better analyzed.
I’m not quite sure if viewport rendering is viewport playback, but according to this, the difference is just 6ms
I like EEVEE, but the final render times are my absolutely biggest complaint: What’s the point of having it, when it needs sometimes longer then cycles and what’s the point if I can get a higher quality in real time in an actual game engine?
And I don’t think that the color management should play a role at all, since I can’t honestly make out a difference in quality between viewport and rendered output
I would, but most of it will be under NDA, at least mine is. The GPU I’m using packs 4Gio RAM, I’m not using a lot of textures… maybe a few dozen megabytes at most ?
Mine is also under NDA (but if a recognized Blender developer wants to take a look, I can mail them an NDA to sign… the .blend file is 900mb right now).
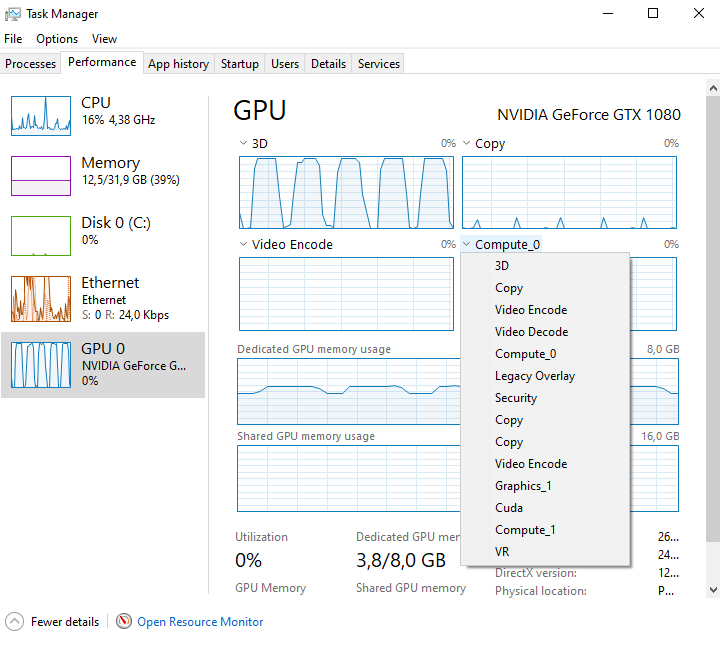
And I wasn’t aware that Windows 10 nowdays has very detailed GPU diagnostics, so I can now say that it’s about 900mb per frame that gets used by the GPU… so… please tell me that Blender doesn’t push the entire file to the GPU per frame? (Yet the copy operation is very little time, and there’s at least a second between the 3D utilization stop and copy begins.)
I have had experience in some scene for example 30 fps in viewport (fullscreen viewport at 1080) vs 0.8 fps final render (at 1080, 1 sample) without it being a out of vRAM problem. But 30 fps vs 0.01 fps is very strange, there must be another problem involved. It would be nice if developers could analyze this kind of scenes.
By the way, for a better comparison, you should measure viweport fps by being viewport occupying the entire screen while playing animation.
Ok, so I measured with a stopwatch. It’s about 10s per frame, so 0.1fps then. I edited the topic to remove the hyperbole (and also measured viewport with Fraps… it’s 30-50fps depending on camera angle).
(But the Time: says 10 minutes right now, and it’s been going for at least an hour, so I don’t know what “time” means there. The other data just flickers past, too fast to read, again, as you can see in the GIF I posted up above.)
EDIT: Also, the progress bar in the main Blender window goes straight to 98%…


 . I’m really speaking about this rumor)