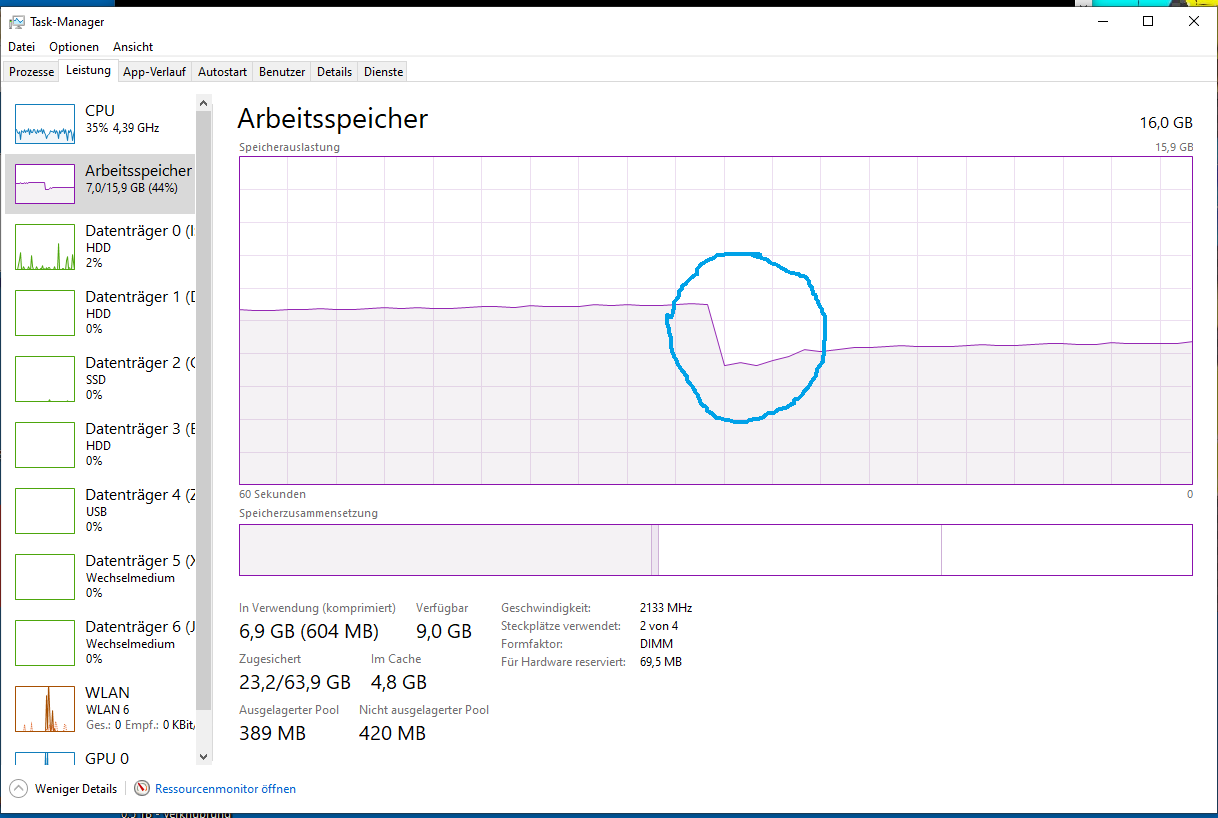
this error keeps appearing when rendering a longer sequence in Blender (only complexer scene files, simple files work) - Blender always crashes roughly after 200 frames - what I noticed in the system diagram is that the ram is continually increasing from 1-7 GB for Blender over this 200 frames. When I keep up the rendering again at the failed frame everything works fine starting at 1 GB ram again and crashing around 7GB ram 200 frames later.
The scene hast like 50 collections, 1000 objects, but everything relativly simple, lowpoly, few textures, only 1 4K png Sequence as texture. Maybe this is filling the ram? Blender forgetting to trash the unneeded old textures? Only guessing. Actually in total System ram there is still left around 2,5 GB when Blender crashes.
Rendering in batch mode. Happens on other Scene too. Always with Eevee. Blender runs alone.
System is GTX 1070, 16 GB, i7 7700K (around 2017) 256 GB SSD, 8TB HHD
EDIT: I use Windows 10 64bit and the Nvidia Studio driver - install newest version right now
I think I could have found a solution, I am rendering 2:30 hours straight already with the newest studio driver… already 500 frames … in the past crashed after 200 frames roughly… could work finally - I am already having this issue for months and updaeted Nvidia drivers several times, now it seems to be fixed I hope, will post, whether I reach frame 6000 LOL
Symbols not available sounds like a stupid error, like someone forgot thumbnails Okay I have no clue of programming, love all the wonderful people, who make all this possible for artists like me
My Phone is filming what is happening on my screen for 2:30 now just in case…
Only thing I still wonder is WHY the ram fills up at all - blender only needs 1GB to render the first few frames, every time I start the render. So why use 7 GB later in the progress when each individual frame is actually happy with 1 GB of ram? Just wondering.
No crashed again… only later - what seems to help a bit is restart before render, so the base situation is an empty memory. Again the crash appeared sometime when the ram is full to 13 GB and 3 GB is empty. Always crashes when ram is (relativly 13GB of 16 GB) full. Never crashes, wenn ram is filled under 13 GB.
EDIT: There is no command to clear ram in bat files? I am quite sure a work around would be to clear ram every 100th frame…
Okay, with the help of Open Office Calc a created a ridicolous work around bat file, that could solve my error… it goes on until frame 6000. The file “simple.blend” is just a lovely grey cube - but what this does it clears the memory… Well let’s see whether it works… good night
cd “C:\Program Files\Blender Foundation\Blender 3.2”
blender -b “I:\01_Animationen_teil1__New_Movie\scenes\B\07 Fruchtbarkeits_Goettin\3D Version 2022\pro\blender\Fru_Goe.blend” -s 1 -e 50 -a
blender -b “I:\01_Animationen_teil1__New_Movie\scenes\B\07 Fruchtbarkeits_Goettin\3D Version 2022\pro\blender\simple.blend” -s 1 -e 1 -a
blender -b “I:\01_Animationen_teil1__New_Movie\scenes\B\07 Fruchtbarkeits_Goettin\3D Version 2022\pro\blender\Fru_Goe.blend” -s 51 -e 100 -a
blender -b “I:\01_Animationen_teil1__New_Movie\scenes\B\07 Fruchtbarkeits_Goettin\3D Version 2022\pro\blender\simple.blend” -s 1 -e 1 -a
blender -b “I:\01_Animationen_teil1__New_Movie\scenes\B\07 Fruchtbarkeits_Goettin\3D Version 2022\pro\blender\Fru_Goe.blend” -s 101 -e 150 -a
blender -b “I:\01_Animationen_teil1__New_Movie\scenes\B\07 Fruchtbarkeits_Goettin\3D Version 2022\pro\blender\simple.blend” -s 1 -e 1 -a
blender -b “I:\01_Animationen_teil1__New_Movie\scenes\B\07 Fruchtbarkeits_Goettin\3D Version 2022\pro\blender\Fru_Goe.blend” -s 151 -e 200 -a
blender -b “I:\01_Animationen_teil1__New_Movie\scenes\B\07 Fruchtbarkeits_Goettin\3D Version 2022\pro\blender\simple.blend” -s 1 -e 1 -a
Okay, my workaround seems to bear fruit, new record, 1100 frames already in 1 go. EDIT: It rendered the entire night 4000 frames, each 10 layer, 40.000 png’s this night. Normally without the Workaround I only get 200-400 frames (10 layer each).
So I assume the bug is happening on the nvidia side, but it only happens when the memory is piling up without a real reason. So maybe blender is sending commands to the nvidia dll that are extreme or not intended?
Nontheless my workaround solves it. Strange. Happens to a lot of scenes on my system, all more complex scenes and Eevee rendering. Edited the calc file a way I only have to enter start, end, file path and file name. Then I can copy everything to a bat file and start rendering. Is actually quite efficient solution.
Since you are using the command line to just render a specifc range i guess you aren’t doing any simualtions… and because the -s 1 -e 1 -a just renders the first frame again… IDK if you really need this…
Anyway: are you using OptiX or something… there was somethign with this and persitent data if i remember correclty … (?)
Of course also something in your shaders or generation could eat up RAM…
I don’t think the blender devs would do something like that… in fact you don’t need the newest hardware to use it at all…
Yes of course it renders the first frame of “simple.blend” a lot of times, that is only the Memory-clear-workaround, only takes 1-2 seconds every 50th frame. Yes you are right I could probably delete this part.
But it solved my issue with multiple scene files since around blender 3.0.
If I try to render 500+ frames at once in Blender or in a *.bat-file it always crashes and the memory is piling up (but never totally full).
My workaround prevents this memory piling up, and so I suppose the crashes. I can now render for 24h without a crash again - but only with my workaround.
I am only talking about Eevee. Cycles always works fine. Yes I checked this persistent data option, too, but only found it in Cycles.
I tried both CUDA and OPTIX setting, but didn’t change anything. But I think eevee only uses OpenGL and is not effected by this setting (?).
So it is a bug on Nvidia or Blender side, caused by unnecessary memory piling up. Because it never ever crashes on the first frames, always just on frame 200-400 when the memory is relatively filled. My workaround is preventing this memory filling. So I suspect it is the cause/trigger for the crash.
To make it clear Memory only fills when I render frames in a row slowly.
I can render 1 frame with 1 GB of ram. And I can do so for every frame manually.
But when I render 10 frames in a row it goes up to 2GB.
When I render 100 frame in a row it goes up to 7GB ram.
So there is actually no reason at all to use all the ram.
EDIT: I was wrong [I supect my 4K image texture sequence to cause the error. The other file has a 1080p image texture sequence. I will give it a try whether this is the cause for piling up the memory.] I deleted all textures and all materials, problem stays. Textures and Materials don’t cause the error.

 .
. Okay I have no clue of programming, love all the wonderful people, who make all this possible for artists like me