Would tonemappers not be better judged by for example how pleasing or accurate results they give for photos taken of real world places? I haven’t compared this one to e.g. filmic though.
These are image formations. The sweep EXR is an excellant testing data for that. It gives you values from “dark” to “bright” from left to right, and yet from left to right in the local “tonemapping” result is completely the same with clipping and skewings.
The sweep EXR is just a convenient tool to see issues that you should also be able to see in “real world photos”.
Try testing this out, judging from the sweep, the “local tonemapper” should also produce a complete mess on this one:
Siren2_arri_alexa35_BT709.exr (3.5 MB)
This one was shot with a real camera, ARRI Alexa 35, here is the ARRI’s Reveal image formation result:

Let’s see how the “local tonemapper” handle this.
“Local tone mapping” is a complete fabrication as best as I understand pictures and visual cognition. That is, there is often an appeal to this sort of nonsense that is typically followed up with “Because this is how our visual system works…”
I am not going to profess that I have a clue how our visual cognition works. What I will offer is a few blunt force examples to showcase that not only does our visual cognition function against the myth of local tone mapping, but in fact behaves completely in opposition to the myth, and reveal the myth to be an utter fabrication.
Consider the following two demonstrations:


Note how in both cases, the spatiotemporal field articulations are not at all “locally tonemapped”, but rather amplified in terms of amplitudes of the signal, relative to field proximity. In fact, the actual stimulus intensities on the diamonds and interiors of the glare / halo are identical.
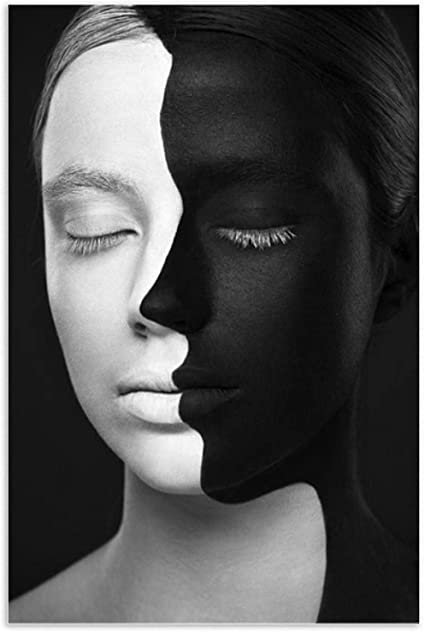
How do we know there is a relational amplification at work? As stated above, the glare and halo demonstration have interior regions that are identical tristimulus, as they are to the surrounding field about the “perimeter”. Yet in the visual cognition process, the magnitude of “lightness” on the interior of the left glare demonstration are amplified well beyond the limits of the display tristimulus range.
In the Adelson Snake case, all four diamonds are identical tristimulus, and yet again we can identify the identical amplification mechanic in the field relationships, and the upper diamonds again are amplified beyond the medium’s capabilities.
This effect also crosses over the temporal domain; our visual cognition will tend to attenuate and amplify some field relationships, as is evidenced by the YouTube demonstrations elsewhere in this thread.
I outright reject the nonsense of local tone mapping, and have little understanding as to where the Bad Idea originated. It seems all of these picture concepts derive from a singular point of failure of a very Newtonian approach to picture understanding, where the false myth of “emulating the stimulus” or “ramming the totality of the stimulus signal into the picture” is pervasive, despite being disproven time and time again.
I believe that while it might be a leap to suggest that we fully understand the attenuation of purity. As values trend upward toward peak output, we ought to be careful to imply that the visual mark is necessarily a “cue” of brightness. It seems to be reified as some information unit, but to necessarily suggest it is “brightness” is perhaps a leap. For example, the attenuation on skin seems to be less about “brightness information”.
A picture is a peculiar assemblage of fields. When an author takes a pencil to paper to form a “line”, we have to respect that in terms of the frequency and time domains, no such “line” exists; it’s nothing more than an assembly of specific frequencies over time. Indeed, if we shift the spatiotemporal sampling, the idea of “line” could be dissolved into a puff of smoke. TL;DR: Zooming out or in will shift the fields of the signal, and the notion of “line-ness” will dissolve toward the more extreme zooms and the aliasing in the visual fields.
From this vantage, we are somewhat forced to think about:
- The spatiotemporal articulation of the signal with respect to frequencies, including quantisation.
- The higher order reification of these signals to “something” way up the cognitive food chain.
The suggestion above to frame a picture as a frequency domain projection relates to 1., and specifically how we can potentially harness frequency projections, or adjacent projections such as Gabor’s interstitial projection between frequency and time, to provide numerical metrics more closely aligned to the visual cognition of “posterization”.
To recap, I am steadfast against the pervasive myth of “local tone mapping” from the grounds of “visual cognition” myths. If one desires to have an orange sun with the frequency of details present at the same magnitude as those of a “face” in a picture, that’s an entirely valid creative goal, but one that runs counter to conventional pictures formed.”local tone mapping” is also in direct collision with visual mark making of “skin”, where the attenuation of purity appears incredibly important.
I am not at all advocating that frequency analysis should be applied to picture formation itself.
Field relationships could be explored as a tool to lay numerical magnitudes down that can be used as indicators of posterization for a given gamut and field frustum representation, including transformation of field relationships in the pictures between mediums. I am advocating that in terms of pre-formation analysis for rates of change, and post formation manipulation of the formed pictures, there are a wealth of tools that are yet to be explored in force.
The other snippet I have in the Testing_Imagery repo actually shows where Reveal seems to have a potential rate of change issue for BT.709 and Display P3.
3 Likes
It didn’t look good with the same parameters as used for the sweep. There was too much monochromatic red and too much black.
I tweaked parameters in the model to get something more presentable:

It’s kind of unfair since the so-called “global tonemapper” used in comparison used the same set of parameters across all the testing EXRs. (If you want to use it in OCIO you need to bake it to LUTs anyways, no tweaking of parameters per EXR possible in the end.)
Though, let’s look at the sweep with the new settings.
There is never “too much” here, these challenging senarios are just what we have been testing against.

Seems like the same problem still exist
Things are completely doomed.
ARRI Reveal looks like this BTW:
The idea of “gamut” mapping is not part of the picture formation.
The more reasonable approach would be a frequency based analysis and fitting from a formed picture in BT.2020 or the more realistic Display P3, to BT.1886 / sRGB.
Its the global part of this particular 2004 tonemapper that doesn’t pass your test, that is, the part that considers all pixels individually.
In the above diving image the local part that considers neighbor area is set to give a very subtle increase in local contrast and I think it can be used with other tonemappers too. However, there’s likely newer results in the field.
Again I just cannot imagine what an “ultimately ideal local tonemapper” should look like, the very principal of “local” seems to be against the entire idea of chroma attenuation.
Just think about the sweep, what should it look like with an “ultimately ideal local tonemapper” ? It would bring the sun down to the same level of the face, which means the right side of the sweep will look the same as the left side, which means clipping. I just cannot imagine how “local tonemapping” could produce an ideal sweep image.
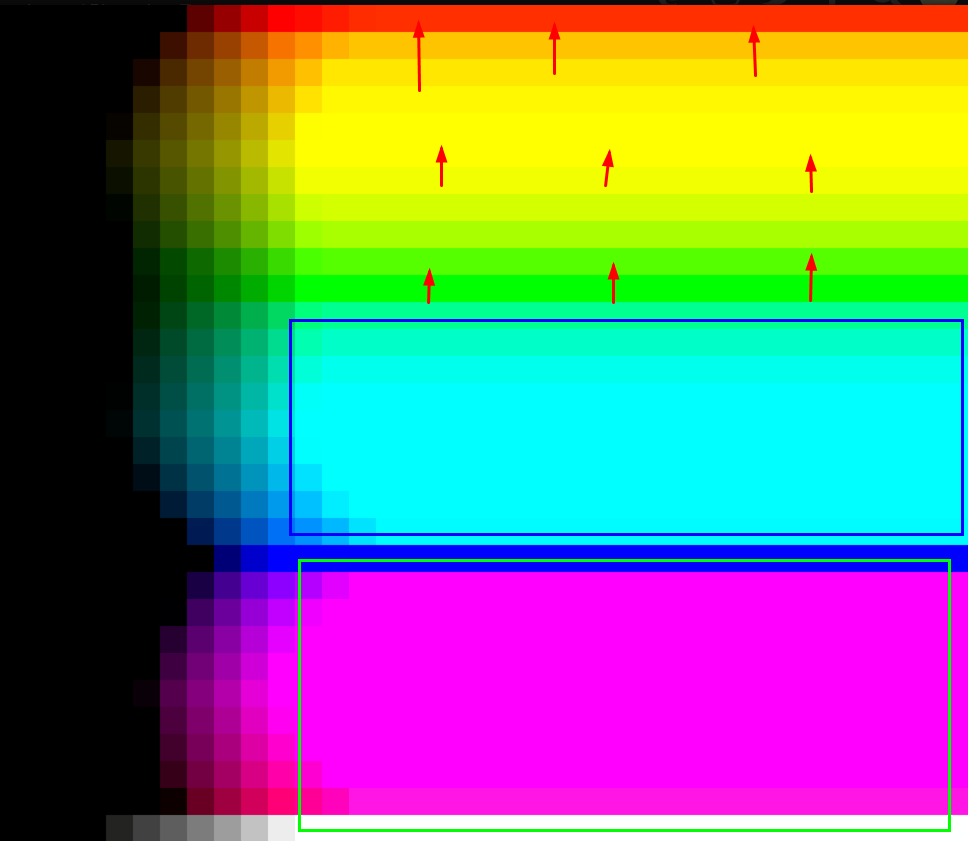
I asked another person on Twitter looking at a more recent “local tonemapping” algorithm for a sweep test last year, this is what they gave me:
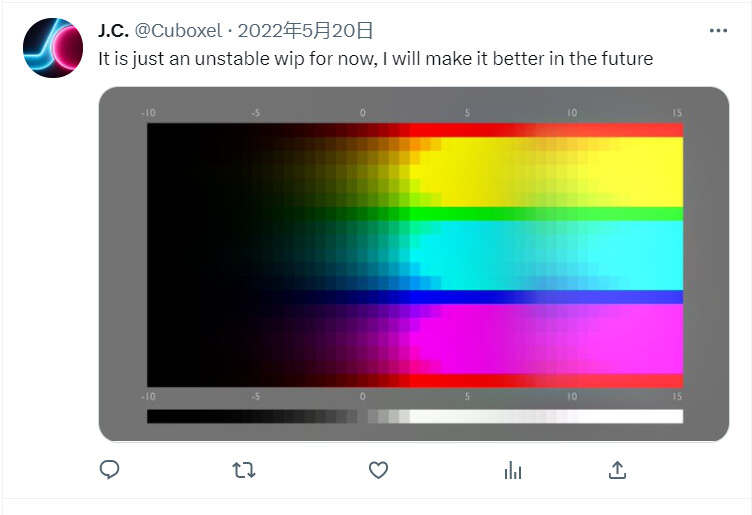
You can see massive areas clipping and skewing, and then a random area on the right side looking exactly like the left side, then back to clipping and skewing. I haven’t been following their update so I don’t know how they are doing now, but I just cannot imagine what it should look like with an " ultimately ideal local tonemapper".
Your result shows how LT can clip things. This result on Twitter shows another behavior. Imagine if the random area on the right side is connected to the left side without the clipping area, the it would look like this:
As the values in the EXR gets higher and higher, the image gets brighter and brighter until it hits the maximum emission strength of the display device (1.0), and then it suddenly gets darker (below 1.0), and starts going up towards 1.0, and then suddenly gets darker, and go towards 1.0 again… It just doesn’t make sense, but I cannot imagine how LT can produce an ideal sweep with the “local” principal in there.
I am arriving more or less the same conclusion:
Ok you’re talking Fourier Transforms, got it.
Or perhaps the refinement to Gabor Filters and, more generally, wavelets, which trade off the fully localized (spatial) view and the fully global (frequency-lke) view.
So are you talking we should investigate what might be done for color in the Fourier domain or some wavelet expansion?
Or are you thinking in terms of spectra per pixel, in which case you transform the energy?
I guess this suggests you’re talking in terms of mapping spectra to colors such that a slightly different spectrum won’t ever cause a jump in colors (which would mean posterization)
Ah, I see, your angle here specifically is to explain/model around some forms of perceptual posterization and, say, Mach lines (that was their name, right) and the like, rather than data-side posterization, since some of that is clearly local frequency or phase dependent.
This, in turn, has little at all to do with spectra, as we’re then in the domain of actual Retinal excitations and how those are further processed.
This is very much in accordance with your frequency-hunch: It means something here is not quite scale-free and therefore scale- (and therefore frequency-) dependent.
Yeah, this clearly requires some spatial awareness / some awareness of the neighbourhood of a pixel / some visual context.
This goes beyond what color management typically does though. To accommodate this sort of effect, you can’t merely map any given datapoint to any given color. The gradient and, probably, 2nd derivative are clearly important.
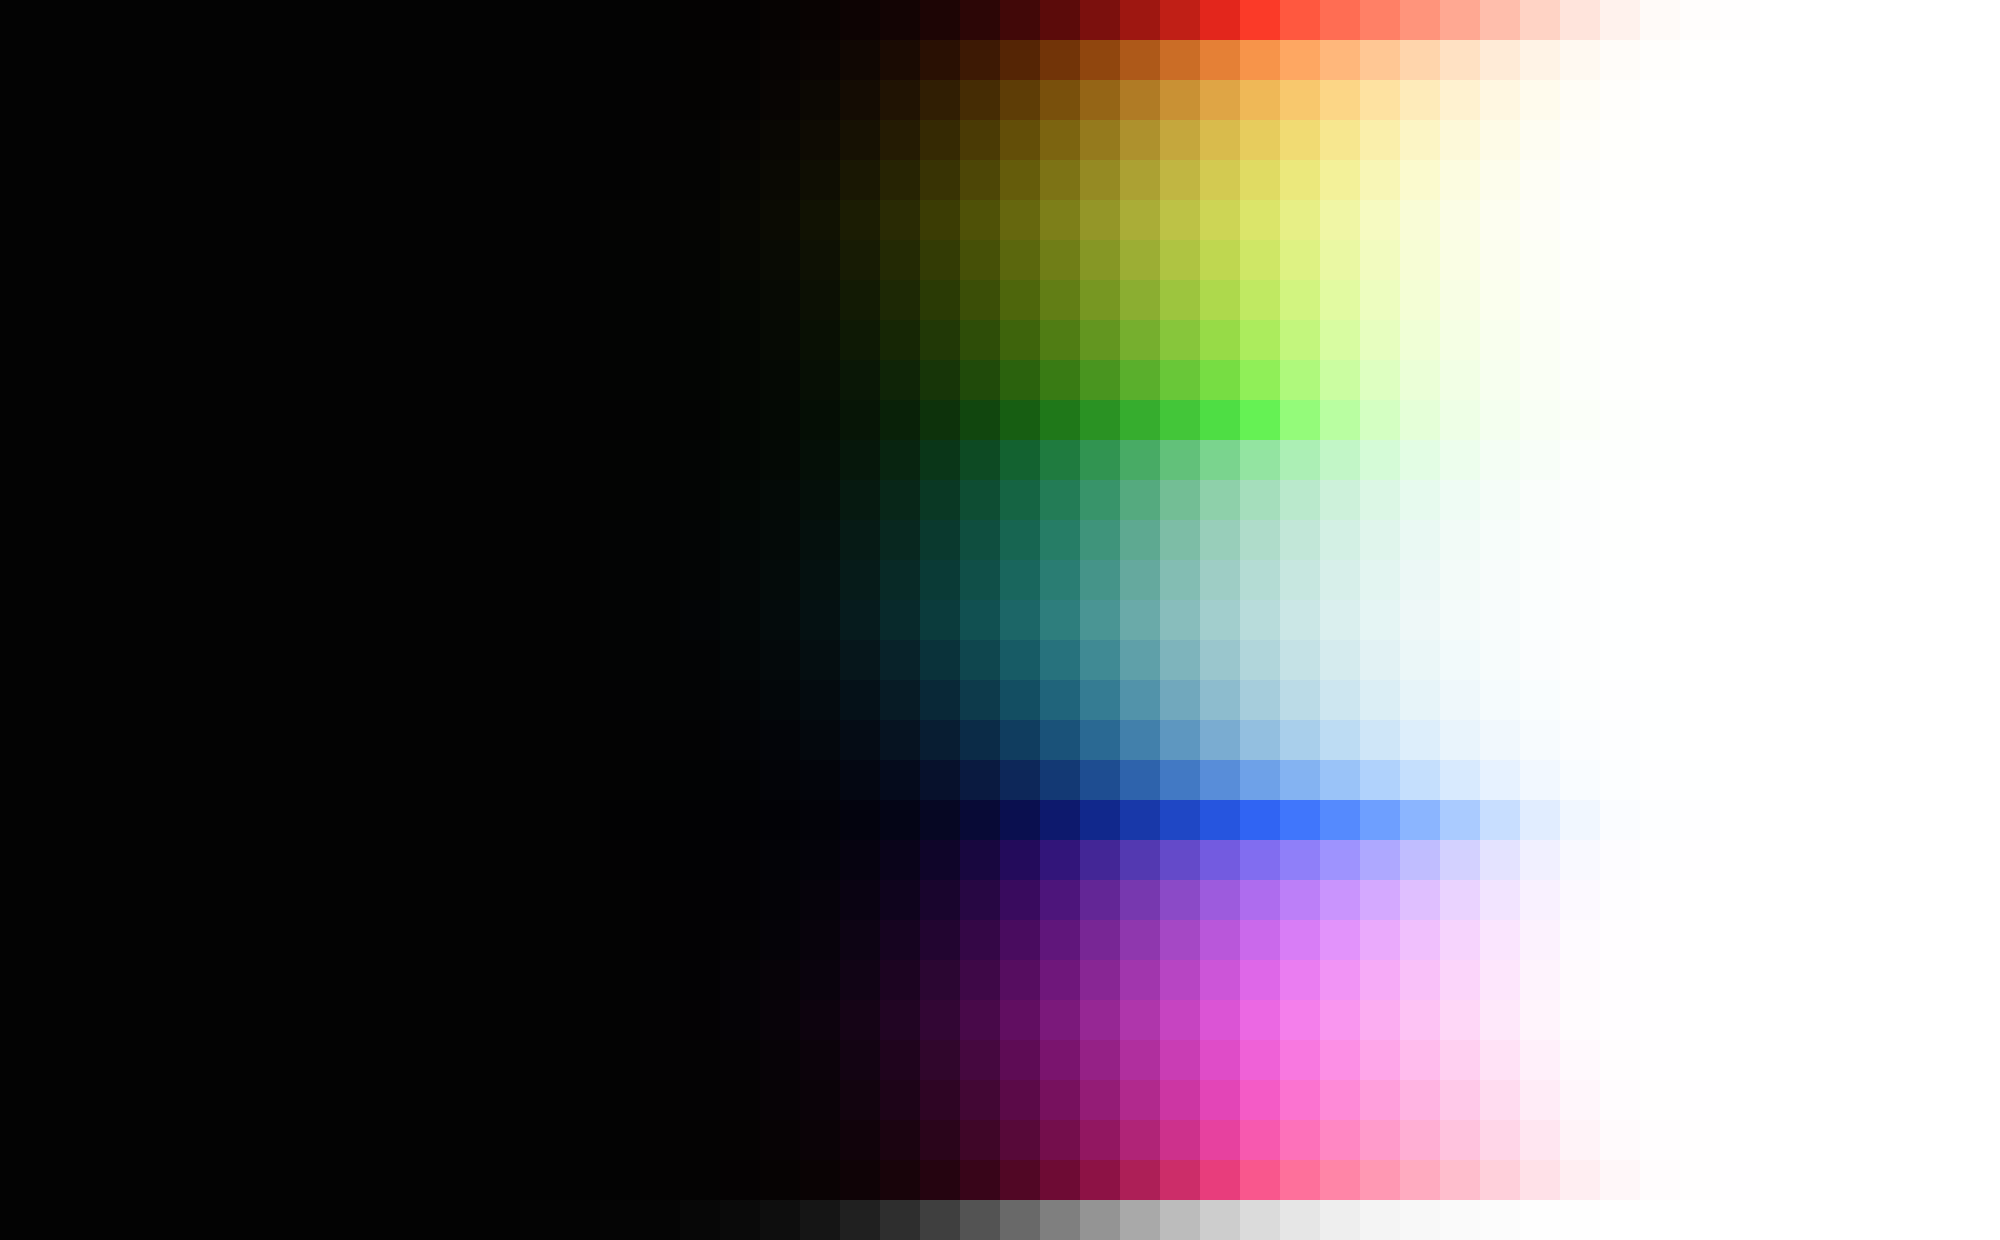
I’m not sure what you did there. As far as I can tell, the background is the exact same, while the graph doesn’t appear to actually be the Fourier transform of that image. That would, analytically and with the assumption that it expands left and right to infinity, look something akin to this (modulo an i due to the antisymmetry of that image):
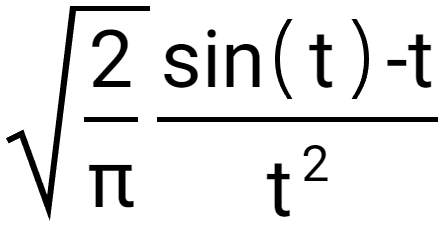
which looks like
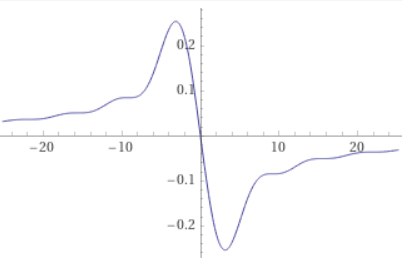
I think as your image fades to grey rather than black, that would add Dirac Delta at the midpoint (equivalently, one bright pixel right in the center in the discrete case), but other than that it ought to look just like this.
Ok this suggests what you are doing is a simplified wavelet transform rather than a Fourier transform.
So you, like, take a Gaussian blur of an image, and subtract the blur from the original, leaving you with some higher frequency curve. It’s effectively a high pass filter for a variety of frequency cutoff choices.
Ok so your suggestion here isn’t about a completely new approach to modelling how data should translate to color, but it’s rather about how to test for remaining deficiencies and edge-cases.
If I understand you right, your take here amounts to “We can’t really do frequency domain stuff within the scope of OCIO-style color management, but we can use it to look for glitches”
Question is, if and when (definitely when) such glitches are found, what to do about them? The whole point here seems to be that we can’t exactly fix those kinds of issues in the spatially sampled domain.
I mean, that makes sense. That way, rather than screen triple-intensities, you are attempting to approximate the actual retinal signal strength. Seems more relevant to perception.
Ok, so you do intend to move away from simple datapoint → color mapping approaches after all. That would be cool but inherently, by definition, neighbourhood-dependent, and would have to be addressed on a different level. Of course that would enable way more stuff. It’d also automatically be much more complex a space to explore.
Well that kinda depends on what you mean by “Local Tonemapping”.
What the name as such means, is, that the mapping from data to color is localized. It may differ based on location and surrounding context.
That’s actually kind of the general direction you seem to try to be taking here.
Now I’m not saying typical Local Tonemapping approaches as have been realized to date are exactly what you are proposing. They may be flawed in important ways. But this wavelet- or Gabor-domain exploration you are proposing pretty much amounts to the same broader design space, taking the neighbourhood to be important rather than merely the precise value of an individual pixel.
Typically local tonemapping tries to smooth out stuff, sure. But it doesn’t have to. The mapping of tones, in principle could be anything. Including mapping a greyscale image to a false color one, say. It’s just not what’s usually done.
Yeah that’s super cool. The diamonds are some “shade of grey” but appear brighter than the “white” (in the sense of RGB 1 1 1 ) border
If we also add the temporal domain, that adds further complexities. Would be really interesting to explore, certainly. But very tough. For instance, just in the same way as how these effects depend on spatial frequency, they are also gonna critically depend on temporal frequency. So different framerates may have different results.
Ok, so now we are back to only using this for coming up with better tests. Perhaps I have misunderstood some parts of what you’re going for. I’ll leave it as is though. I’m sure you’ll tear it all apart as you usually do ![]()
I think technically you can consider an aggressiveness parameter of sorts. But in principle, yes. The sun is so bright, it even appears as a (usually) glaring white circle in the sky for our eyes. It’d be silly to attempt to map that insane range that even clips the incredible dynamic range our eyes can handle (compared to cameras) to anything that isn’t, effectively, clipped white, if, in the same image, anything else isn’t supposed to look essentially black.
Yeah this sort of result is awful lol
That said, for a sweep like that, the “localized” part of local tonemapping doesn’t really make sense to begin with. Neighbouring swatches don’t actually represent a proper neighbourhood in the same way neighbouring pixels do in “a proper image”. It’s probably not the right kind of test for that sort of approach to begin with.
Given those examples, I definitely agree. I don’t think this has to be the case though. I just think the goals of the people who come up with these variants simply don’t align with the goals we have here.
If we were to take seriously the additional capabilities that localization can offer, we probably could use that to further inform image formation. Just not for the purpose of crushing dynamic range. Instead, the target could specifically be to avoid posterization, say. That would likely give completely different kinds of local tonemappers.
But anyways, the point is moot so long as we explicitly cannot reference the location of any given pixel and the values of its neighbours for our transformations. We really can just look at individual pixels by themselves and decide based on that. And frankly, I think the design space is complicated enough as is. Adding two or three (one temporal) extra dimensions to consider is only gonna cause further headaches.
That’s unrelated to the idea of using these frequency approaches for coming up with testing scenarios to be clear.
I have a ridiculous running hypothesis that visual cognition, in terms of lower order “sense”, is highly correlated to a continuous time projection, rather than the discrete time sampling we employ. More specifically, that visual cognition is closely uniform to continuous time analysis, rather than discrete time samples. If a signal, assuming a reasonable domain metric, is uniform in continuous time, it likely is broadly congruent to a uniform cognition.
Not entirely, although there are continuous time projections of spectral relationships to the LGN signal outlined above.
Not so much the “spectrum”, but rather that if we focus on the potential signals from / around the LGN, expressed in a continuous time projection, we might be able to correlate the spatiotemporal fields with cognition of posterization. There is a degree of frustum dependency here in our signal analysis, but it seems that there’s enough “wow” correlations to make it worth exploring.
Indeed, although it feels closer to LGN signals, rather than purely retinal. Granted, bipolar cells increment and decrement using an internal opponency that already firmly locates gradients in the cellular construction.
This! Specifically that latter portion of your sentence relating to the 2nd derivative. Note that again, the domain of magnitude is incredibly important here. We can’t just slap the theory on RGB and think it will work.
Correct. And there’s some complexity in how to “combine” some of the octaves. Kingdom suggested a basic response normalization. In my specific demonstration case, it was based off of Laplacian of Gaussians, and then selecting some regions of octaves and taking the mean, which seems to work pretty well in that they don’t exhibit slopes near higb gradients that would suggest “halos”. Granted, fixation on things like text on paper will halo along time, but typically it seems the microsaccades etc. keep the sharp gradients at a minimum, so mean or normalization works pretty well to draw a congruency to visual cognition.
Yes, purely analytical to start!
Assuming we can sculpt a purely analytical process that broadly correlates to posterization detection through thresholds, we could in theory back project the analysis to tune a curve in an AgX approach. Again, this is not ideal in the big picture sense, but in short term utility, this is a huge win if we can consider random colourimetry to form a picture up out of. We could minimize the curve to the analysis and see how it holds up.
100%! We can use a reasonable model to test some of the curve assumptions. At the very least, we could also end up with a tool that gives us a “Hey look here on this picture here!” tool that could flag certain regions for human cognition evaluations.
Even that is a win!
We already know the source of posterization:
- Ratio of complements in the inset.
- To steep first derivative / too strong power in the curve.
We can use the analysis to potentially at least allow a human to tune the curve, and if we get a handle on it, use a minimization to drive the three curve parameters.
I don’t think so because I strongly believe that “tone” doesn’t exist in the open domain colourimetry.
In fact, I haven’t been addressing “tone” at all, and doubly not even focusing on any sort of picture forming. I tend to think it is a wholly other structure.
To make it a bit clearer, we could imagine a wholly other non-visible data, which I consider colourimetric data to be. Normals, depth, XRay magnitudes, audio magnitudes etc. Each we could form into a picture, but there would be no confusion over the fact that we would be creating pictures from data.
I do not believe colourimetric data is any different here, and is only confused because of peculiar crossed concepts. Not that I personally place any validity on the whole idea of “local tone mapping” at all. It’s goofy in my mind, and creates assumptions of mechanics and things that simply do not exist. But to each their own…
100% What is more interesting perhaps is that there’s no “ramp up” as there is in the classic Glare demonstration. It makes the case that the continuous time projection is hugely important.
I originally had thought this, but frankly, it isn’t like we have ever not had time in the ordinates. It’s either discrete time, or continuous time. Time is always there. How it is accounted for is indeed an interesting discussion.
Not at all. Using the approach for analysis is effectively the first stage of utility. If something can be arrived at, it in turn can be expanded to back projecting for creative purposes. But baby steps…
Warning! False! Try it! Even carefully blotting out the sun disc itself will almost always reveal a hue, articulation depending of course! Also I’d caution against conflating pictures with ecological perception. I can’t stress enough that no one understands how pictures work, and as such, assuming there’s some sort of “resemblance” to ecological cognition is fundamentally problematic.
I most certainly do not seek to snuff out any sort of experimentation. I tend to think that the utility of continuous time experiments are related to the assemblage of marks within pictures-as-texts, but the assumption of “the” picture formation mechanic is clearly problematic here. None of it addresses the ideas of chromatic attenuation, amplification, nor how these picture-text glyphs even work.
Even a black and white picture is absolutely confounding when we stop to evaluate what exactly it is, as an assemblage of continuous time gradients in a picture!
There’s technically ways to go continuous, but for most practical purposes, the discreteness is just a matter of practicality.
Typically, generally speaking, you can emulate continuity by modelling stuff as a noisy process where the accurate continuous result happens “in expectation” rather than exactly. This may actually be closer to what our perception works like too, taking continuous averages and the percepts we have are basically an expectation of sorts.
Digital computers don’t like that though. Algorithms exist, but our hardware is designed in a way that makes those relatively less efficient.
If I’m not mistaken, that’s covered by “retinal and further processed”. LGN is what happens like immediately after the initial retinal excitation, right?
That’s also the stage where, yes, gradients, and also edges in various orientations as well as “temporal gradients” happen, afaik? - Like, the temporal component is easiest seen with stuff like the waterfall effect. I’m pretty sure that happens at that level too, or one layer further at the latest.
Anyways, basically LGN signals is what I was talking about there.
in how far does that relate to time? It’s a static image. I’m not quite sure what you mean by “continuous time projection” here.
I mean, I suppose it is, but also, static images are a thing.
Granted, they aren’t quite a thing, in that our eyes are usually always on the move, and so even a completely static scene will change in terms of how it is projected onto our retinas. But the impression still is of a static image. The percept is static.
yeah, this is where you currently lose me.
Are you saying in terms of, like, how our eyes adjust to stimuli over time, kinda being increasingly unable to distinguish stuff that’s constant?
That’s the only way I can see time playing a role for static images. Specifically if you force your eyes to remain as still as possible.
As soon as your eyes are allowed to move around freely, static images will not cause that anymore.
One of my favourites from psych class. I’m sure it’s been posted in this thread before, but no loss in repetition:

2 Likes
The concept is to glean cognitive correlations from the continuous time projection, and the thresholds that emerge.
While I believe that there is likely a very high degree of probability that “expectations”, or perhaps more explicitly learned patterning, plays a role in higher order cognitive forces, the above is more about simple thresholding in terms of correlations to cognition of “posterization” or other such “problems” in pictures of a given spatiotemporal dimension.
In relation to the more “classical” model of Claude Shannon / Dennis Gabor’s projections. If the ordinate Y axis is discrete time, then the abscissa X axis is the orthogonal continuous time projection. A continuous time projection can offer us the emergent traits outlined above.
In many ways it is not a “static” image. That could be a “cognitive illusion”. For example:
- The fields are arranged in a specific spatiotemporal articulation at a given field size, and we can’t “look around” a picture without also considering the traversal in time.
- The field size “resolution” itself is a time discrete signal.
- The duration that we fixate, and the influence on the field, is also time bound. See also Troxler’s fading above. The duration we cognize, and the nature of the saccades, influence the reification process.
Are we certain it’s a “percept”, or is it potentially more complex cognition that we reify as continuous? The latter perhaps could be “the ultimate illusion”.
A really solid demonstration of this is the way we think about “synchronous”. That is, we often think that a signal is “synchronous” with respect to time if the magnitude of the modulation is periodic. But we also know this isn’t the case! We cognize the time based on what seems to be a continuous time signal analysis. Michael Bach’s incredible demonstration is here, in that the demonstration can only be either / or. Only one of these statements can be correct:
- The modulation of the magnitude is time.
- The gradient of the magnitude (LGN?) results in the cognition of time.
It should be worth pointing out that if you try Bach’s demonstration above, putting the split disc toggle on amounts to a reification of motion in cognition, which is fascinating in these sorts of discussion of “time”.
At any rate, the point I’d highlight is that we can’t divorce ourselves from the “time” dimension, whatever the hell that is, and there are implications in terms of visual fields as per Troxler or Tse’s discs etc.
We don’t really have a locus as to where this “adjustment” happens, nor even a reasonable method to evaluate the magnitudes! I have exactly zero idea what “constancy” is for example. Gilchrist showed that when we place a highly absorptive “black” card in a complete dark room, and illuminate it, that it appears as “white”. When an identical “black” card is placed alongside it, and illuminated at a higher level, that new card becomes the “white”, and the other card is evaluated as a “grey”.
As such, I have no idea what “constant” even means at this point. Totally at a loss other than to suggest that “constancy” is some purely cognitive manifestation, that constantly shifts along time. ![]()
If you are careful with your cognition that seems to try and bury these things into the idea of “constancy”, you can indeed see that the above seductive belief is false.
Tse’s discs are a wonderful example here, where based on fixation, and more importantly cognition of thought, the discs can move around somewhat freely in terms of “darker”. There’s about as much “constancy” here as there are whims in our cognition.

At any rate, the key part of a basic assembly for diagnostic purposes, seems to be within reach via a rather basic Laplacian of Gaussian at even two levels; one slightly down from high frequency, and one very low.
From there, it would amount to a matter of some diagnostic thresholding or even perhaps a gradient signal evaluation. Not sure. There’s traces there that are highly correlated to the visual cognition along most of the demonstrations in this mega-thread. Perhaps Tse’s discs would be an interesting case to showcase regions of “ambiguity”?
not sure what I’m meant to be looking out for here
And I can’t sway I’m entirely following you on the non-staticness just yet either
Here is what we can consider essentially static for a “static” image:
The observable, as located in space, remains constant (for practical timescales - I mean, certainly, it won’t remain constant for literally ever. The universe probably doesn’t last that long. But for relevant timescales, we can assume it to be constant)
Of course, you are able to move around, thereby seeing that observable as a variety of slightly, and sometimes massively, different stimuli.
But if we assume you are, say, comfortably seated in front of a well-calibrated screen, that shows a certain image, then at the very least the stimulus is going to be near constant.
Now the processing of said stimulus depends on myriads of other things, some of which are time dependent (i.e. the system is built to especially capture movement, and so starts losing contrast of stuff that doesn’t move), and some of which might get interpreted as movement. A carefully crafted such stimulus, as we all know, can give rise to illusory motion. Such as the classic image of “snakes” that are just careful circles.
In at least those two different senses we have time dependence of sorts:
- the contrast loss of constancy (I’m sure there is another name for this. I don’t know the “proper” term, but I think you know what I’m talking about here)
- the appearance of movement
Those two seem fundamentally different, as one is an adaption over time, whereas the other, I think, comes down to you slightly moving your eyes, which causes minute shifts in the patterns which gets interpreted as motion of the stimulus rather than motion of your eyes.
This is going to be related to some sort of sampling rate, I’m pretty sure. It’s, in effect, a sort of Moiré-like pattern across time.
I suppose I can’t see how to test for any of that though, including with your currently presented methods:
The stimulus itself, no matter what basis you choose to explore it, is constant, except for whatever sort of motion you yourself do with your eyes.
And that’s a difficult experiment to do without carefully calibrated eye tracking.
That’s the thing you’d sorta have to “blur over” here. The motion of your eyes.
It’s theoretically interesting, sure. But I don’t see us being able to pull off relevant experiments here at all
Depending on fixation point, and time spent fixating, as well as cognition, each disc will modulate in terms of “darker”. That is, it is possible in this case to cognize any of the discs as being darker. Hence not “static”, but unstable. To start, try moving one’s fixation point to the different small dot positions. Then try different regions and different cognition; the darkness can actually be “willingly” reified on different discs in much the same way that a Necker cube can be reified differently in cognition.
Troxler demonstrations exaggerate the time effect, and showcase how this seductive idea is not at all constant, but variable based on field response across time. The “constancy” is plausibly a higher order reification process.
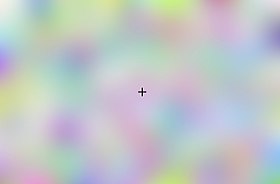
This specific animated version showcases how the neurophysiological signals are forever fluctuating based on time in relation to fixation gaze point. Note that while this demonstration of fixation on the cross illustrates extended fixation, we can observe that there is indeed a highly temporally related component. If one fixates for slightly longer than typically when reading text, or literally any visual field, the temporal aspect and micro saccades will create visual field halos, for example.
Coupled with Tse’s discs, it is a reasonable conclusion that the temporal-cognitive reification process is “always on” and varying with the lower to middling order signals; there’s a peculiar temporal-cognitive dimensionality even when stimulus is static, as in the first example above.
The two are one and the same. One can’t move one’s eyes or fixate one’s eyes outside of time.
The point isn’t to get hung up on the temporal aspect, but to merely highlight that it is always present, and clearly interacting at all times along physiological-cognitive levels.
False.
And again, if one obsesses over this, they are framing the problem in the wrong direction. This isn’t Newtonian, but utterly phenomenological, which means the experience is all we have to go by.
The experience is:
- Subject to biochemical temporal relations. EG: “pumps” that replenish chemicals in the visual chain.
- Subject to temporal relations of fixation.
- Subject to shifting temporal, and modulating relations of cognition. Tse’s discs or Necker’s cube, or any of the other demonstrations that bring reification into work.
This is all to say that while it is an impossibility to model these, time is always on. Including in the “constant” spatiotemporal sense, which is what permits the projection along a continuous time axis in the first place.
I believe you missed the point here. You wanted to argue over constancy. There is no such creature. It is illusory.
The sole point of focusing on this blunt force reality is that it simultaneously permits a continuous time representation of the picture field as a signal with apparent correlations to cognitive percepts.
I’d not get hung up on something just because it feels uncomfortable, yet is undeniably factual when we reframe the issue as entirely phenomenological as opposed to the counter factual Newtonian mindset.
First of all, thank you all for the time spent on developing and discussing colour in Blender! It’s very much needed, and very interesting to read.
I have a few questions regarding Agx in Blender. A lot of addons break when using Agx, and I’m guessing it’s because of the config file?
Is there a reason why we can’t have both the old and the new colours available, and keep compatibility with addons?
For example, the Adobe Substance addon works with vanilla Blender, but can’t assign textures when Agx is active. If you copy an object with the texture assigned, it will work with Agx too. So, Substance is probably assuming something is present, which isn’t. There are a few more addons that break in much the same way.
The colours with Agx is much better, so I would prefer using it, but it’s pretty limiting when it breaks stuff.
Is it possible to replace wording in the config file, to get better compatibility, and still use Agx?
I guess it depends on how and why exactly these addons break.
Do you have something like error messages or something to that effect to share?
But ultimately it’d be up to the addon creator to maintain their addon…
Also, what version of AgX are you using?
Colorspace names for sRGB 2.2 and Generic Data are already back to sRGB and Non-Color in Gitea version, as requested by Brecht.
Long term though, Blender’s python API seems to only expose the only colorspace name, aliases don’t exist for python addons. I believe long term speaking, Blender needs to expand its aliases implementation.