Feedback / Development: Filmic, Baby Step to a V2?

This is one thing I am not sure of, both the matrix and the curve would produce the BT.2020 red as more purple/pink, is this a problem?

I think this might be acceptable because this is similar to what I saw with TCAMv2:

Though values within BT.709 does compress in a chromaticity linear fashion as I checked.

Here is my guess:

This is probably what happened?

It’s linear so I don’t think a problem.

I am hesitant to migrate to P3 as working space, partially because the Spectral branch is still using hardcoded BT.709 spectral reconstruction. My config was built partially as a preparation for spectral Cycles, so maybe wait until they get the spectral reconstruction done first.

1 Like

Any chromatic attenuation before the image mangling, should plot straight lines toward achromatic. As long as they chart straight line trajectories, the result is heading in a proper direction.

Bending before image mangling is a Bad Idea. Get maximal information into the cauldron prior to image formation, using straight lines to achromatic.

TCAM v2 is a different thing, with unique issues. Sort of less than ideal as a comparison point.

Remember that there is a sort of basic assumption that image formation is going to distort, via the per channel mechanic. The important part of the compression prior to this stage is straight lines. Otherwise mixtures are going every which way, all at once. It’s a genuinely bad sign if any curvature happens prior to the image formation step. If there are straight lines, the rest is a rate of change issue, which although is a house of cards, can be negotiated.

Short term, spectral values, or even values beyond, need to follow those straight lines.

Won’t matter, as indirects will move outward anyways. P3 is likely “better” for working space picking, due to the reasonable luminance of the primaries. Even limiting an albedo to a slightly inset subset of P3 makes sense.

It should provide a pretty reasonable middle ground for rendering, and potentially a better entry point for compressing to sRGB or expansion to BT.2020.

There will be huge resistance if the shift doesn’t happen during Spectral Cycles, so wiser to sort it out prior to then.

Given @kram10321 has a reasonable spherical solution for compression / expansion, there’s little reason to not migrate to P3.

2 Likes

might be a matter of the quality settings. One of them, if not maxed out, explicitly compresses colors (UV or CrCb I think) more than luminosities (Y), by the logic that we are less able to tell the difference. But in this case it just so happened to be extremely obvious.
It’s a big reason of why, despite the size, I’ve been using PNG throughout. The images do look a lot better now, thanks

Ok so for this we need another one of those xy plots but with fewer hues so it’s not filled solid, and we can clearly see how individual hues travel and whether they curve or are perfectly straight, right?

This is a complete non-factor in my books. The spectral reconstruction is going to be changed anyways. You can already do various color space variations without issue. It shouldn’t be all too much extra work to provide multiple I think?

Already done it. I am mostly sure we are doing it right:

Though I don’t have a way to implement your curve now. I will just use the matrix for now, unless you one day throw me a LUT that I can use.

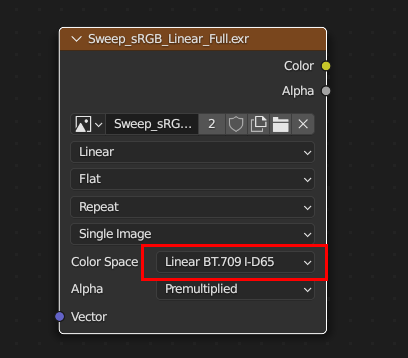
Yeah actually changing the working space is easy enough, just change the scene_linear role to p3 and done (maybe also the color_picking role to prevent the color picker values from going crazy). I am just not sure of the consequence, that brings, like every RGB input in people’s project will now become P3 primaries and Blender doesn’t have a way to auto convert the values yet, etc.

Looking nice! Can you go all the way to grey to make double sure though? It’s difficult to tell from short curve pieces whether they actually curve.
I recommend going for like 12 evenly spaced hues (giving you the Notorious 6 and their half-way in-betweens) across all saturation levels

I have no idea as yet how to generate LUTs. If anybody explains how to do that, I can give it a go.
If it’s a bunch of python, I can very likely oblige. I just need a starter guide or something

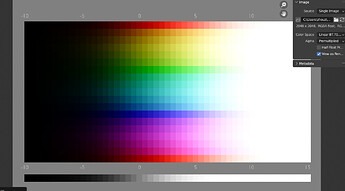
Ok I see the problem. We’d have to basically rerender our test images with those new primaries to fully make use of that?
Although shouldn’t the input space not really matter? It gives you the correct values already. Some of them might be negative because they land outside the working space, but once you’re back to XYZ, they (Matas notwithstanding) should all be “correct”. They may not fully cover the range of saturations, which would be good to have, but they will have valid points in XYZ.
All that matters, I think, is that the chosen output space is P3?

This involves changing your f1 and fi parameters to be smaller but here it is:

Perfectly straight lines.

Already rendered EXR should be fine, I mean existing .blend files.

The RGB numbers will stay the same, but the interpretation of that number will be different. Meaning the Linear BT.709 (1, 0.5, 0) from earlier project will become Linear P3 (1, 0.5, 0), and they are completely different in terms of XYZ chromaticity.

So in order to have the .blend file to be completely compatible, you need to bake every RGB input socket into image textures, because currently only image texture has the source colorspace setting.
image

Maybe in the future they can implement the convert colorspace node to shader editor, and have the .blend file memorize the RGB input’s colorspace, then if the working space is different, auto add a convert colorspace node. But that’s already my imagination, they don’t seem to even think about implement the node to shader editor, never mention the auto conversion.

Also, I want to ask you folk’s opinion, what should the default_float role be now? (The default colorspace for imported EXRs)

Should it be the current working space Linear DCI-P3 I-E? But most EXRs out there are Linear BT.709 I-D65, should we use the working space or should we use what people would import the most?

Could this be helpful ? Lut calculator
https://cameramanben.github.io/LUTCalc/LUTCalc/index.html

but i guess you want to save your resulting data from inside blender?Then maybe you should save a linear normalized curve output as numeric table .Afaik you need such table to generate a lut.

I don’t think that’s quite the right approach? Right now you’re doing sweeps of a single color at various luminosities but the same saturation level, right?
But I think you should sweep a single color at various saturation levels and equal luminosities, and see how that behaves?
There should not be a need to fiddle with the parameters like this.

This ought to be true for regular Cycles, but stuff rendered in Spectral Cycles should be unaffected.
Like, if you pick a color in Spectral Cycles, it’s defined by a spectral upsample, which still will be according to the correct primaries. I.e. if you pick a color out of sRGB but render in P3, the end result given that color selection is actually gonna look identical. Or should anyway.
The problem is just that it’s difficult to pick RGB values from beyond sRGB. And I guess in the future the UI should make that clear somehow. Specify what space the color is selected from, if various methods exist.

But that really doesn’t matter at all for testing purposes right now, I think. We got plenty of prerendered or photographic tests that ought to work for our purposes. So we can be ready when the time comes to support some wider gamut in spectral rendering.

Probably go with the most common situation if it can’t be determined automatically.

As far as I can tell, unless I’m missing something, sadly no. This lets me select a bunch of camera presets to generate LUTs for those specific cases.
What I’d need is a way to generate the relevant data based on my own custom math.

I could easily reproduce my math in python in principle. I just need to know how to programmatically generate a valid LUT

If you save your custom curve as table,then you can select no camera as input ,select custum curve and your output format.should work?

Maybe we should ask the python guys how to get this table out as file ?

Well remember this is pre-formation, the compression happens because of the curve, otherwise the entire sweep stays at the boarder unchanged as a single triangle. So the only way to plot it is to have the curve compress further. It’s pre-formation afterall.

Again it defeats the purpose, we are testing your curve compression pre-formation, some other desat would be some other compression algorithm, which is irrelevant.

Your curve does compress in a chromaticity linear fashion, I am pretty sure now.

The thing is, the upsampling/reconstruction should happen after the interpretation of the RGB numbers, meaning the BT.709 defined values will be first interpreted as P3 before being reconstructed.

My concern is, if using Linear BT.709 I-D65, people might file bug report of why exporting rendered EXR and then import it again will look different…

2 Likes

gathering info about lut creation
https://nick-shaw.github.io/cinematiccolor/luts-and-transforms.html

pylut

1 Like

is it possible to keep the color profile in the meta data? That would be the best approach imo:
Default to what’s most common, but attempt to determine automatically based on metadata (which would be set correctly by Blender in case of Blender rendered exrs)

1 Like

I wonder what the original source of this is, because this references a bunch of Figures that are only called “X” but the text implies it’s different Figures and none of them are present. Clearly this is copied, either from another website, or from some paper. (I’m guessing the former though)

It also simply compressed what’s clearly code blocks into a single line. Great job, whoever did this.
“import colour LUT = colour.LUT3D(name=’LUT Name’) LUT.domain = ([[-0.07, -0.07, -0.07], [1.09, 1.09, 1.09]]) LUT.comments = [’First comment’, ’Second comment’] LUT.table = f(LUT.table)”

I’m guessing that reads like

import colour
LUT = colour.LUT3D(name='LUT Name')
LUT.domain = ([[-0.07, -0.07, -0.07], [1.09, 1.09, 1.09]])
LUT.comments = ['First comment', 'Second comment']
LUT.table = f(LUT.table)

but why the heck copy it like that???

It does mention some good information though. Something I’ve been wondering about:
The simplest LUTs are just evenly spaced, and most formats only permit such spacings. But the CLF and Cinespace formats allow for nonuniform spacing which can help reduce reproduction errors.

In principle I can very easily create a big table in, say, a CLF format, but I’d have to figure out how best to place my samples. I’ll have to properly look into colourScience.py though. If anybody has a reasonable working example for code creating some arbitrary 3DLUT, I can probably gleam from it what I need.

I tried implementing a 3DLUT in python now.

Please advice what settings to use. This is just the simplest possible linear sweep using my old parameters. From what I’ve read, there are certain shaped sweeps that might perform better. I also don’t know what range or resolution is appropriate. Currently this is silly in that it only works for XYZ values up to 1.07. Clearly they could be much larger. So this is more a proof of principle than anything.

import colour
import numpy as np


def subtract_mean(col):
    mean = np.mean(col)
    return col - mean, mean


def add_mean(col, mean):
    return col + mean


def cart_to_sph(col):
    r = np.linalg.norm(col)
    phi = np.arctan2(col[1], col[0])
    rho = np.hypot(col[0], col[1])
    theta = np.arctan2(rho, col[2])
    return np.array([r, phi, theta])


def sph_to_cart(col):
    r = col[0]
    phic = np.cos(col[1])
    phis = np.sin(col[1])
    thetac = np.cos(col[2])
    thetas = np.sin(col[2])
    x = r * phic * thetas
    y = r * phis * thetas
    z = r * thetac
    return np.array([x, y, z])


def compress(val, f1, fi):
    fiinv = 1 - fi
    return val * fi/(1 - fiinv * np.power(((f1*fiinv)/(f1-fi)), -val))


def transform(col, f1, fi):
    col, mean = subtract_mean(col)
    col = cart_to_sph(col)
    col[0] = compress(col[0], f1=f1, fi=fi)
    col = sph_to_cart(col)
    return add_mean(col, mean)


def main():

    f1 = 0.9
    fi = 0.8

    LUT = colour.LUT3D(name='Spherical Saturation Compression')
    LUT.domain = ([[-0.07, -0.07, -0.07], [1.09, 1.09, 1.09]])
    LUT.comments = [f'Spherically compress saturation by a gentle curve such that very high saturation values are reduced by {((1-fi)*100):.1f}%',
                    f'At a spherical saturation of 1.0, the compression is {((1-f1)*100):.1f}%']

    x, y, z, _ = LUT.table.shape
    for i in range(x):
        for j in range(y):
            for k in range(z):
                col = np.array(LUT.table[i][j][k], dtype=np.longdouble)
                col = transform(col, f1=f1, fi=fi)
                LUT.table[i][j][k] = np.array(col, dtype=LUT.table.dtype)

    colour.write_LUT(LUT, "Saturation_Compression.cube")
    print(LUT.table)
    print(LUT)


if __name__ == '__main__':
    try:
        main()
    except KeyboardInterrupt:
        pass

The file this created is:
Saturation_Compression.cube (1.1 MB)

and the following description:

LUT3D - Spherical Saturation Compression
----------------------------------------
Dimensions : 3
Domain     : [[-0.07 -0.07 -0.07]
			  [ 1.09  1.09  1.09]]
Size       : (33, 33, 33, 3)
Comment 01 : Spherically compress saturation by a gentle curve such that very high saturation values are reduced by 20.0%
Comment 02 : At a spherical saturation of 1.0, the compression is 10.0%

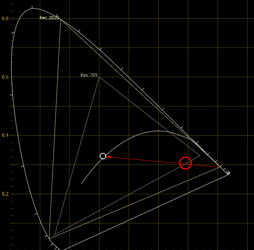
Not working

It seems to have problem as soon as the sweep reaches open domain. Could it be the domain of the LUT?

The first link uses color python,if i am not wrong,then you have to install color python if you want to use this method (or better say commands).

The second link uses pylut ,which need to install ,if you want to use pylut commands.

I read that OCIO uses a specific format,have to look at the chronik if i can find it.
edit,here red first for 3d lut,4th post (red is the cube format)
https://groups.google.com/g/ocio-dev/c/hWgMrUDoaVs

here some format descriptions
https://learn.foundry.com/nuke/content/reference_guide/color_nodes/generatelut.html

maybe the lut baking functions from ocio are good enough?shaper explaned as well
https://opencolorio.readthedocs.io/en/latest/tutorials/baking_luts.html

commandline tools for ocio like lut creation

@kram10321 it seems we still need the “basic shaper to cover the range”

yes, definitely. Hence,

I don’t know how shapers work. It’s a good start, that the LUT is readable at all though. I can work with this. Just need further guidance is all

I changed LUT domain to be 0 to 1.

And It turned out in the config I just did this:

        - !<AllocationTransform> {allocation: lg2, vars: [-12.473931188, 12.473931188]}
        - !<FileTransform> {src: Spherical_Compression.cube, interpolation: linear}
        - !<AllocationTransform> {allocation: lg2, vars: [-12.473931188, 12.473931188], direction: inverse}

Add a log curve before and cancel lt after, and that get rid of the artifacts:

But then the compression seems to completely not taking effect:

My guess is that in the python math, it needs to assume the log curve at the start, decode it to linear, do the math, apply the log curve again for the LUT range. I think the LUT domain setting can be left at 0 to1 in this case.