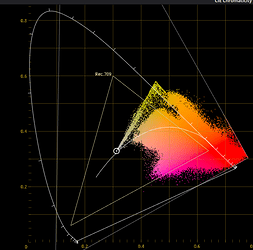
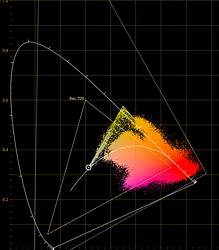
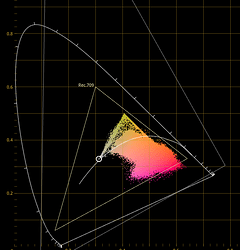
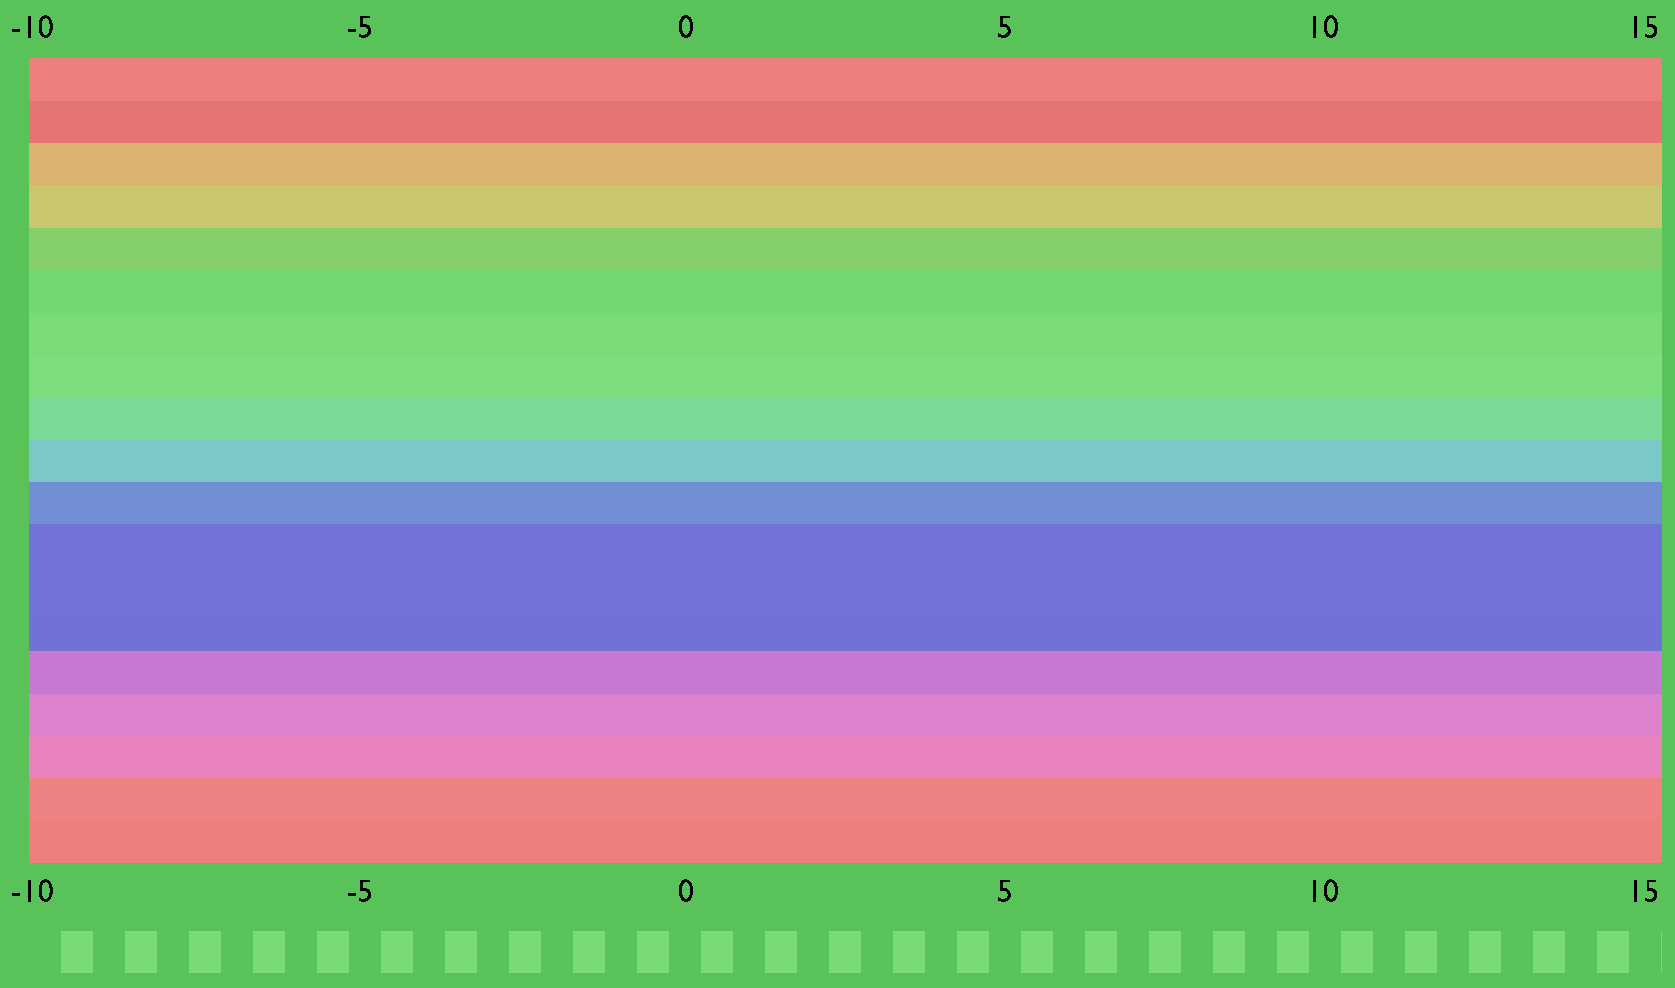
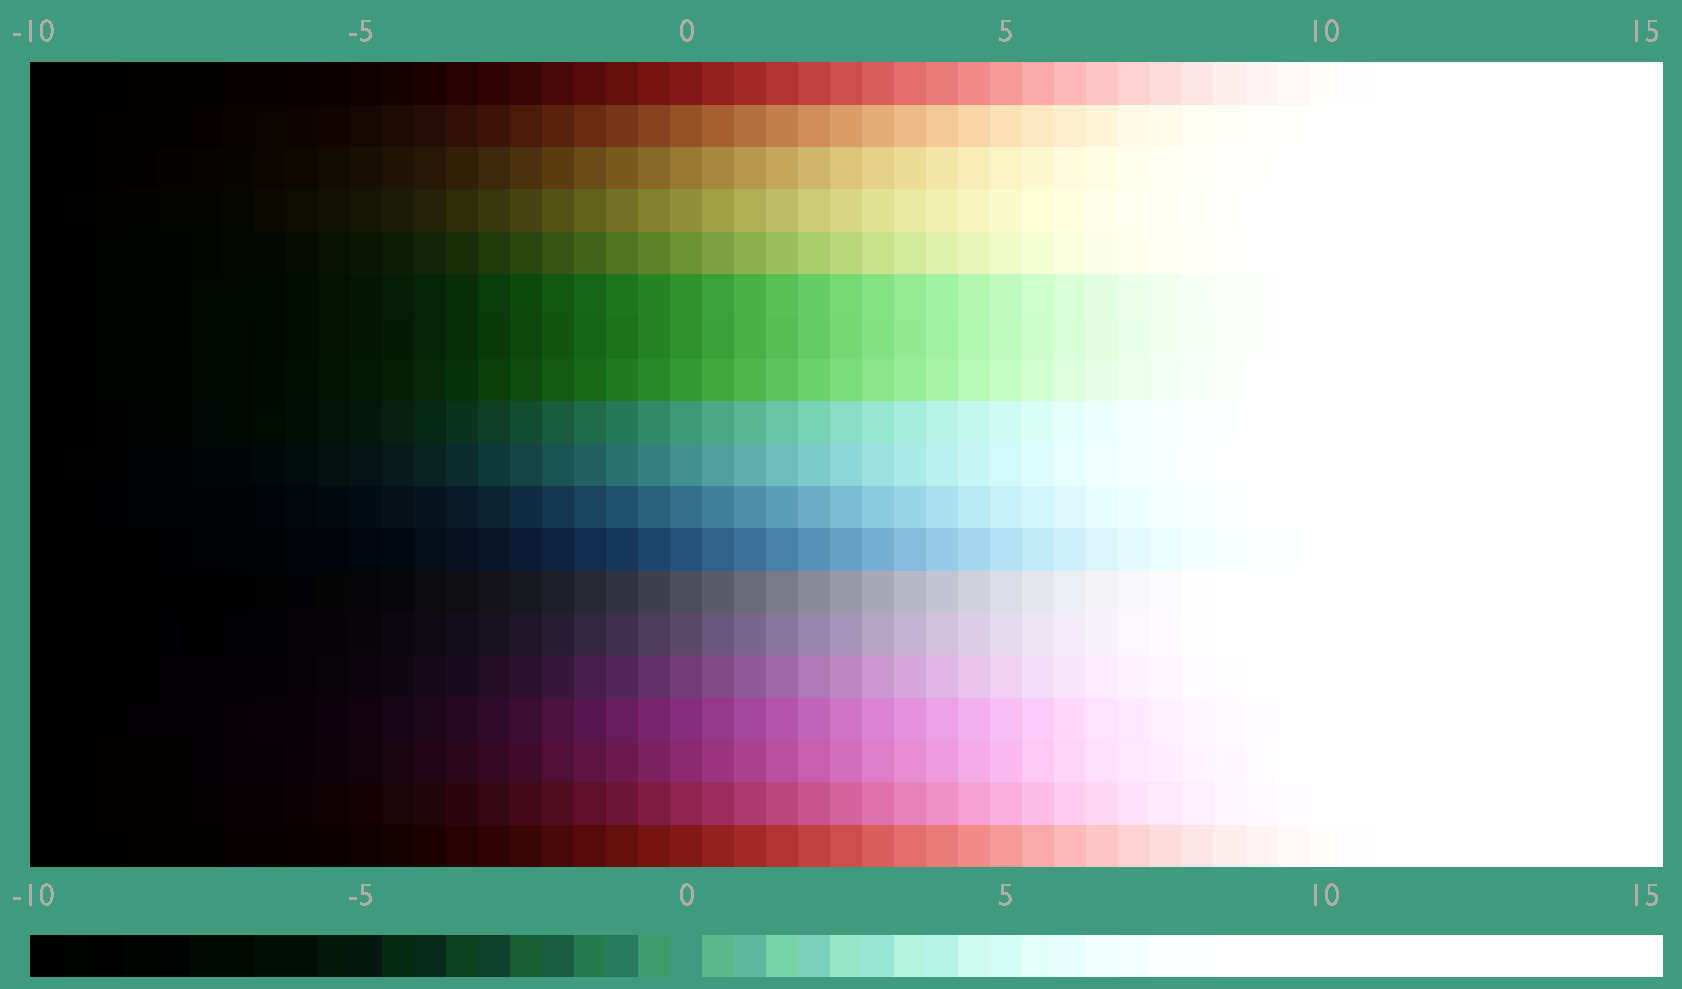
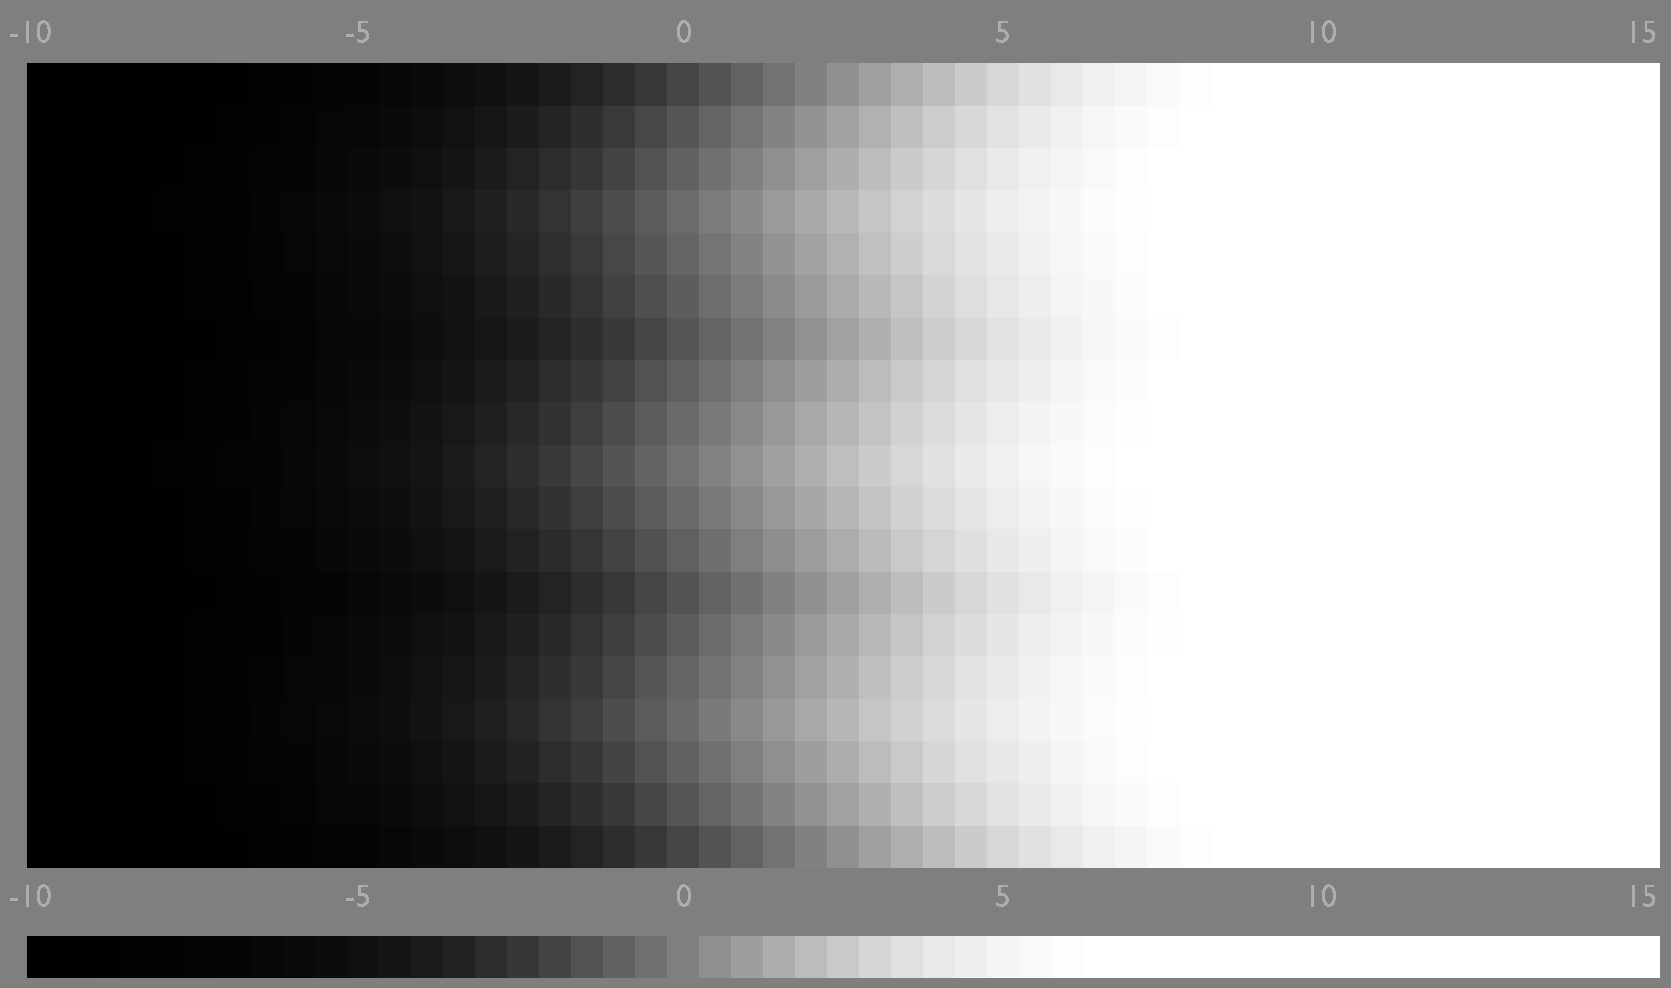
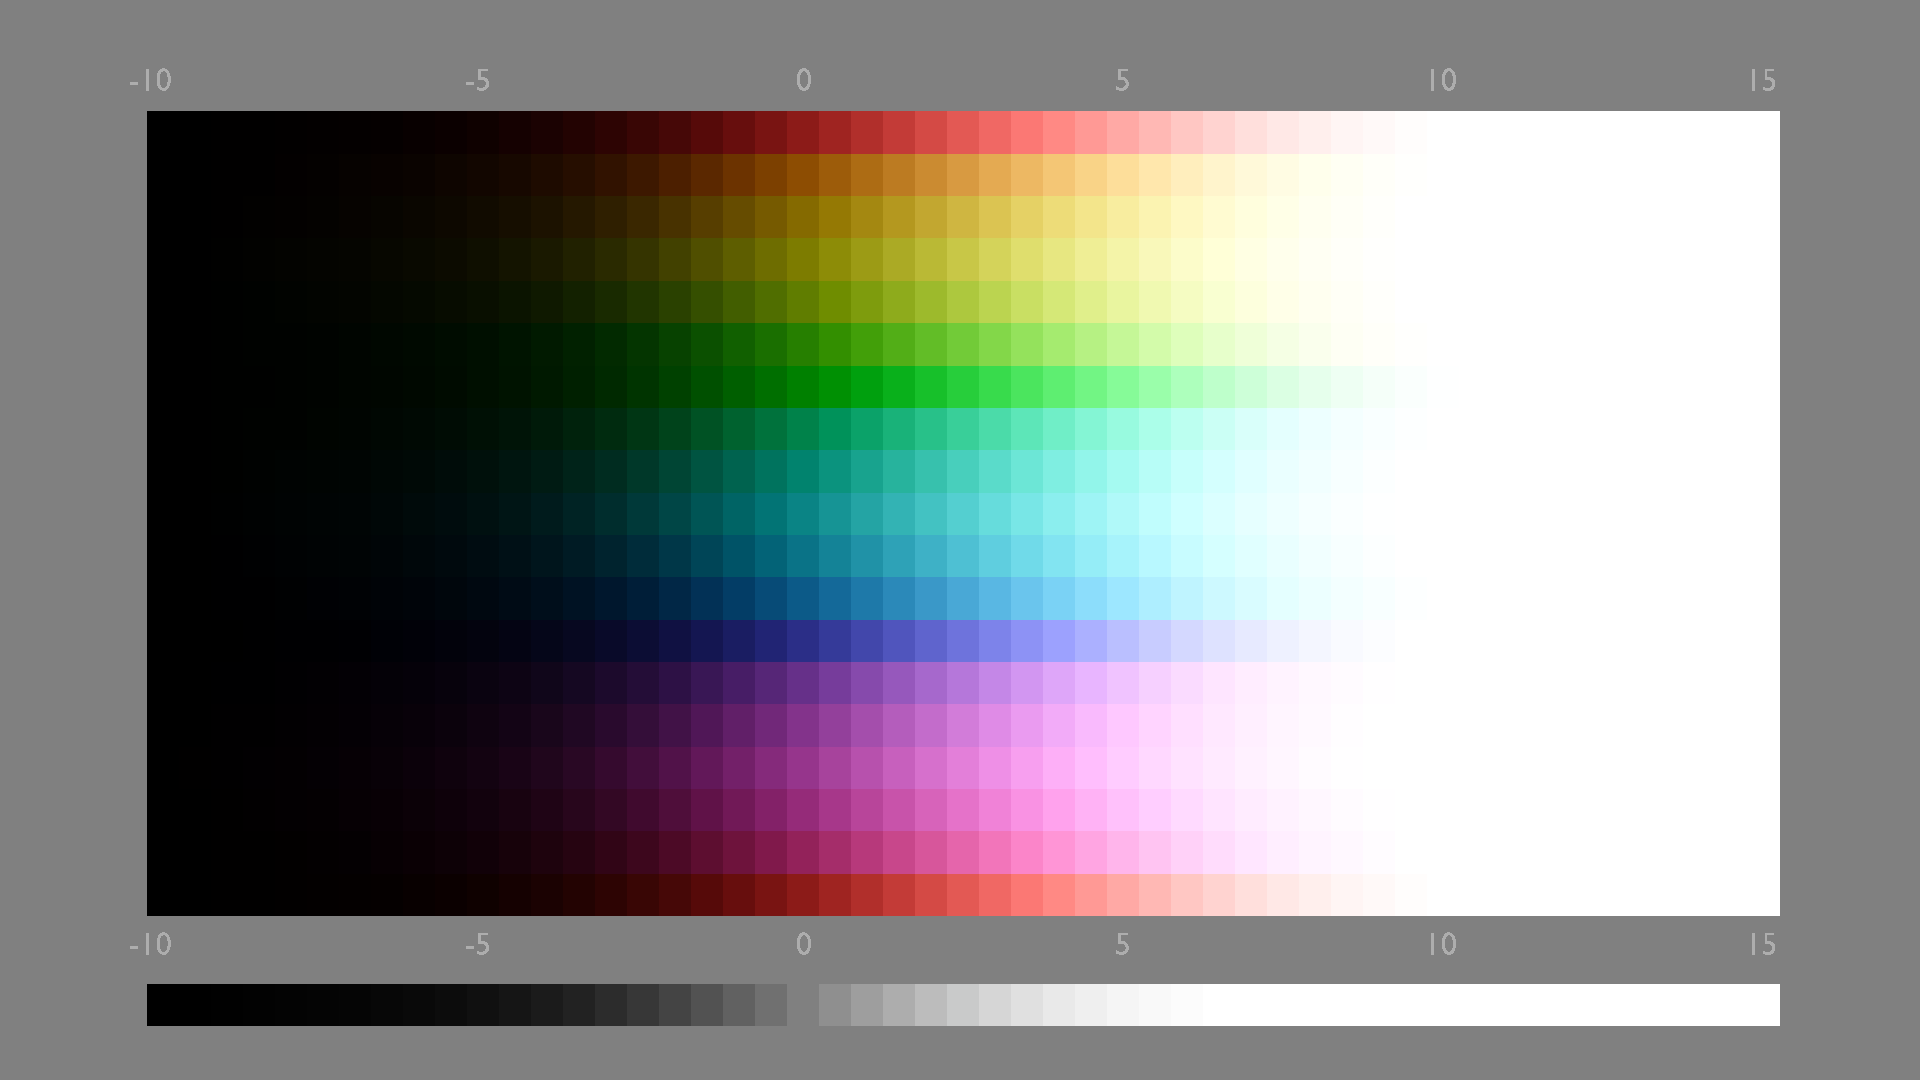
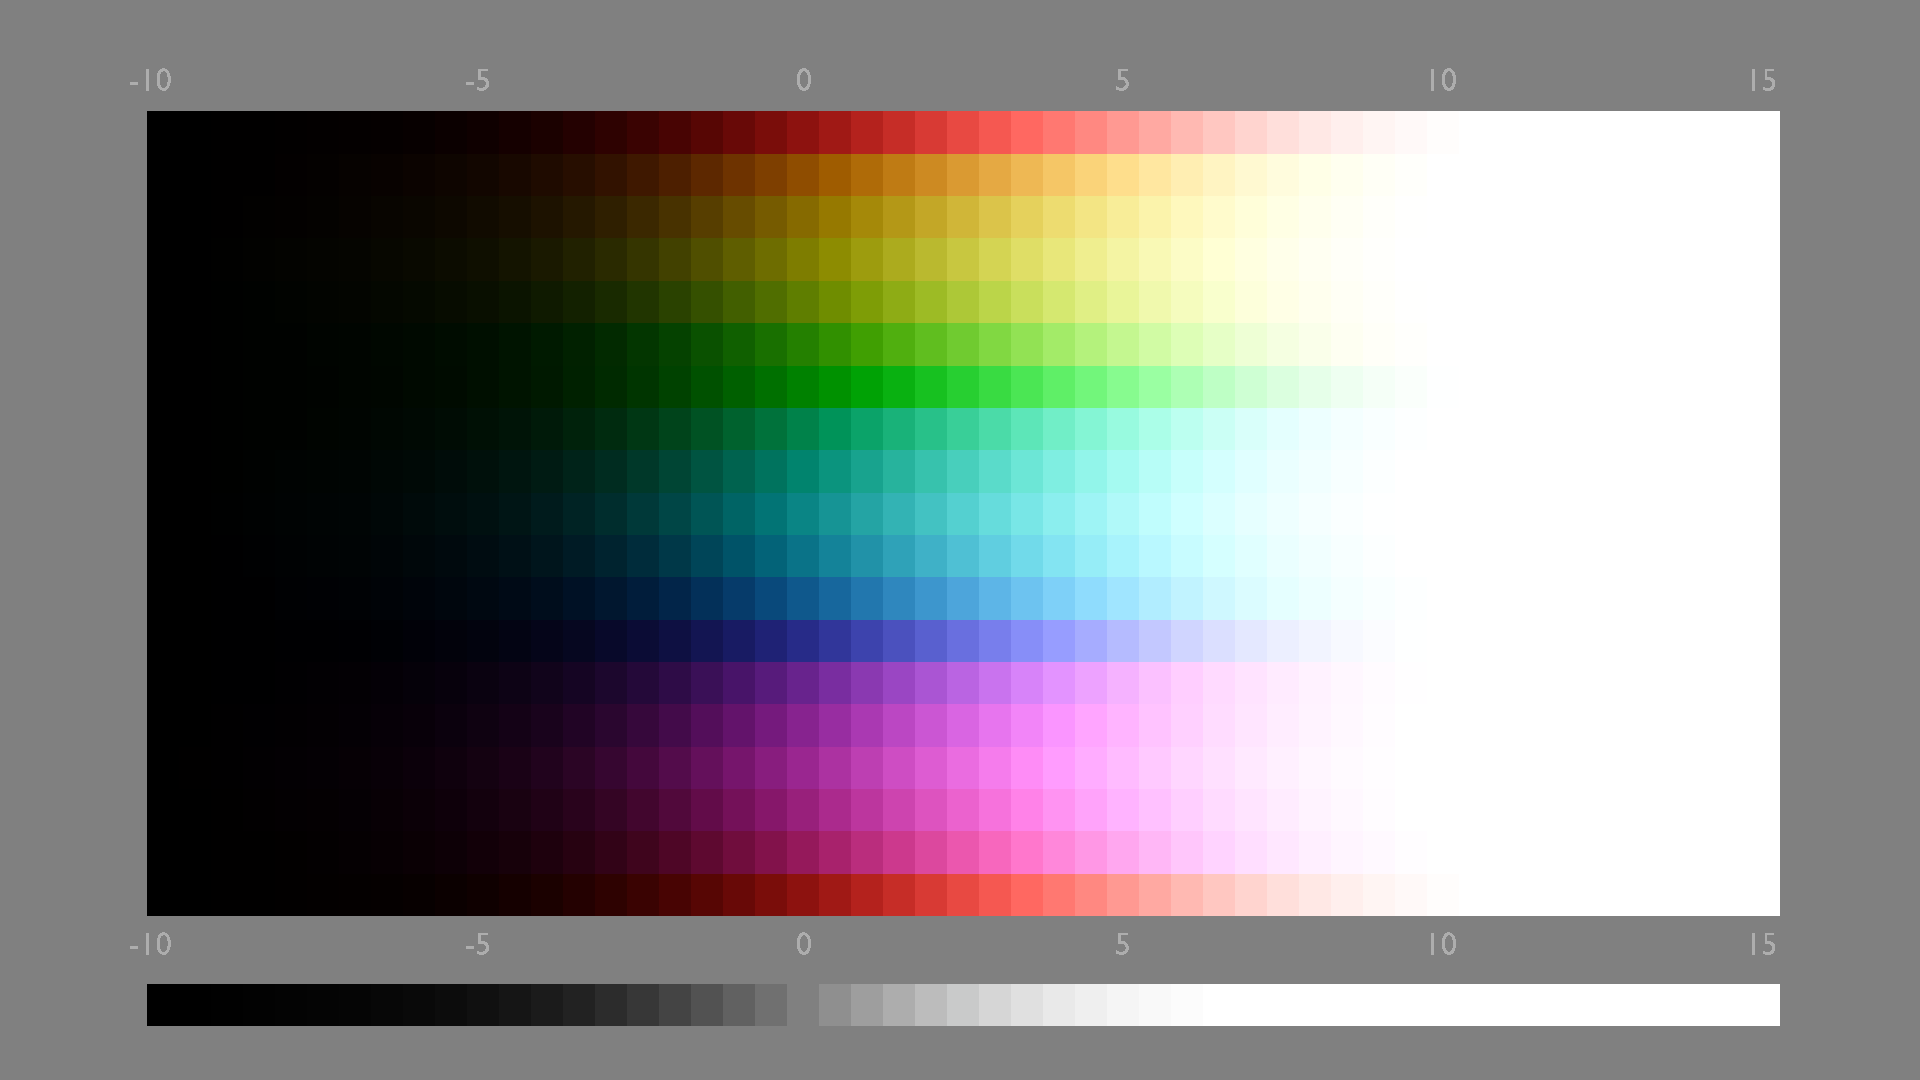
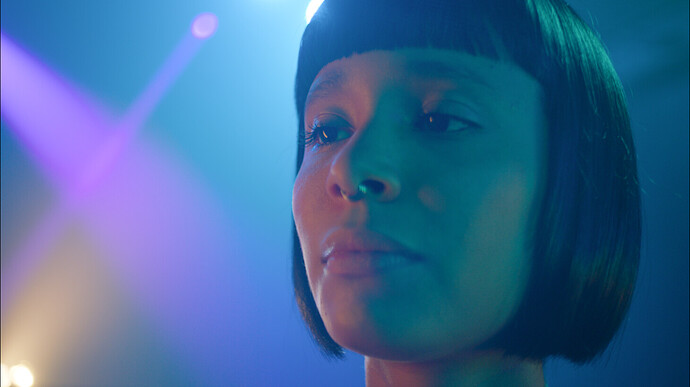
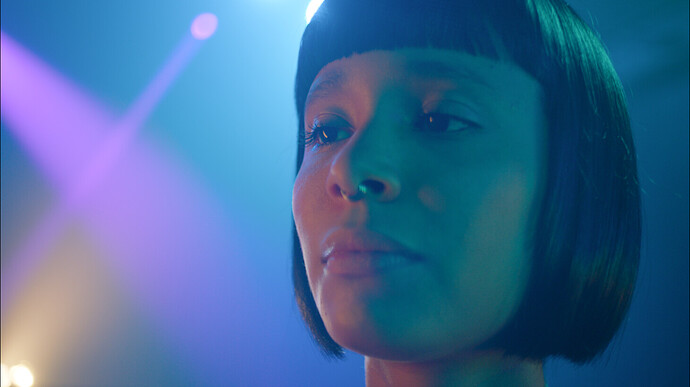
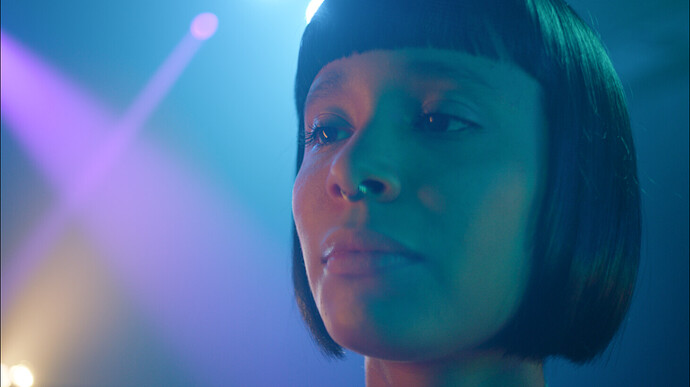
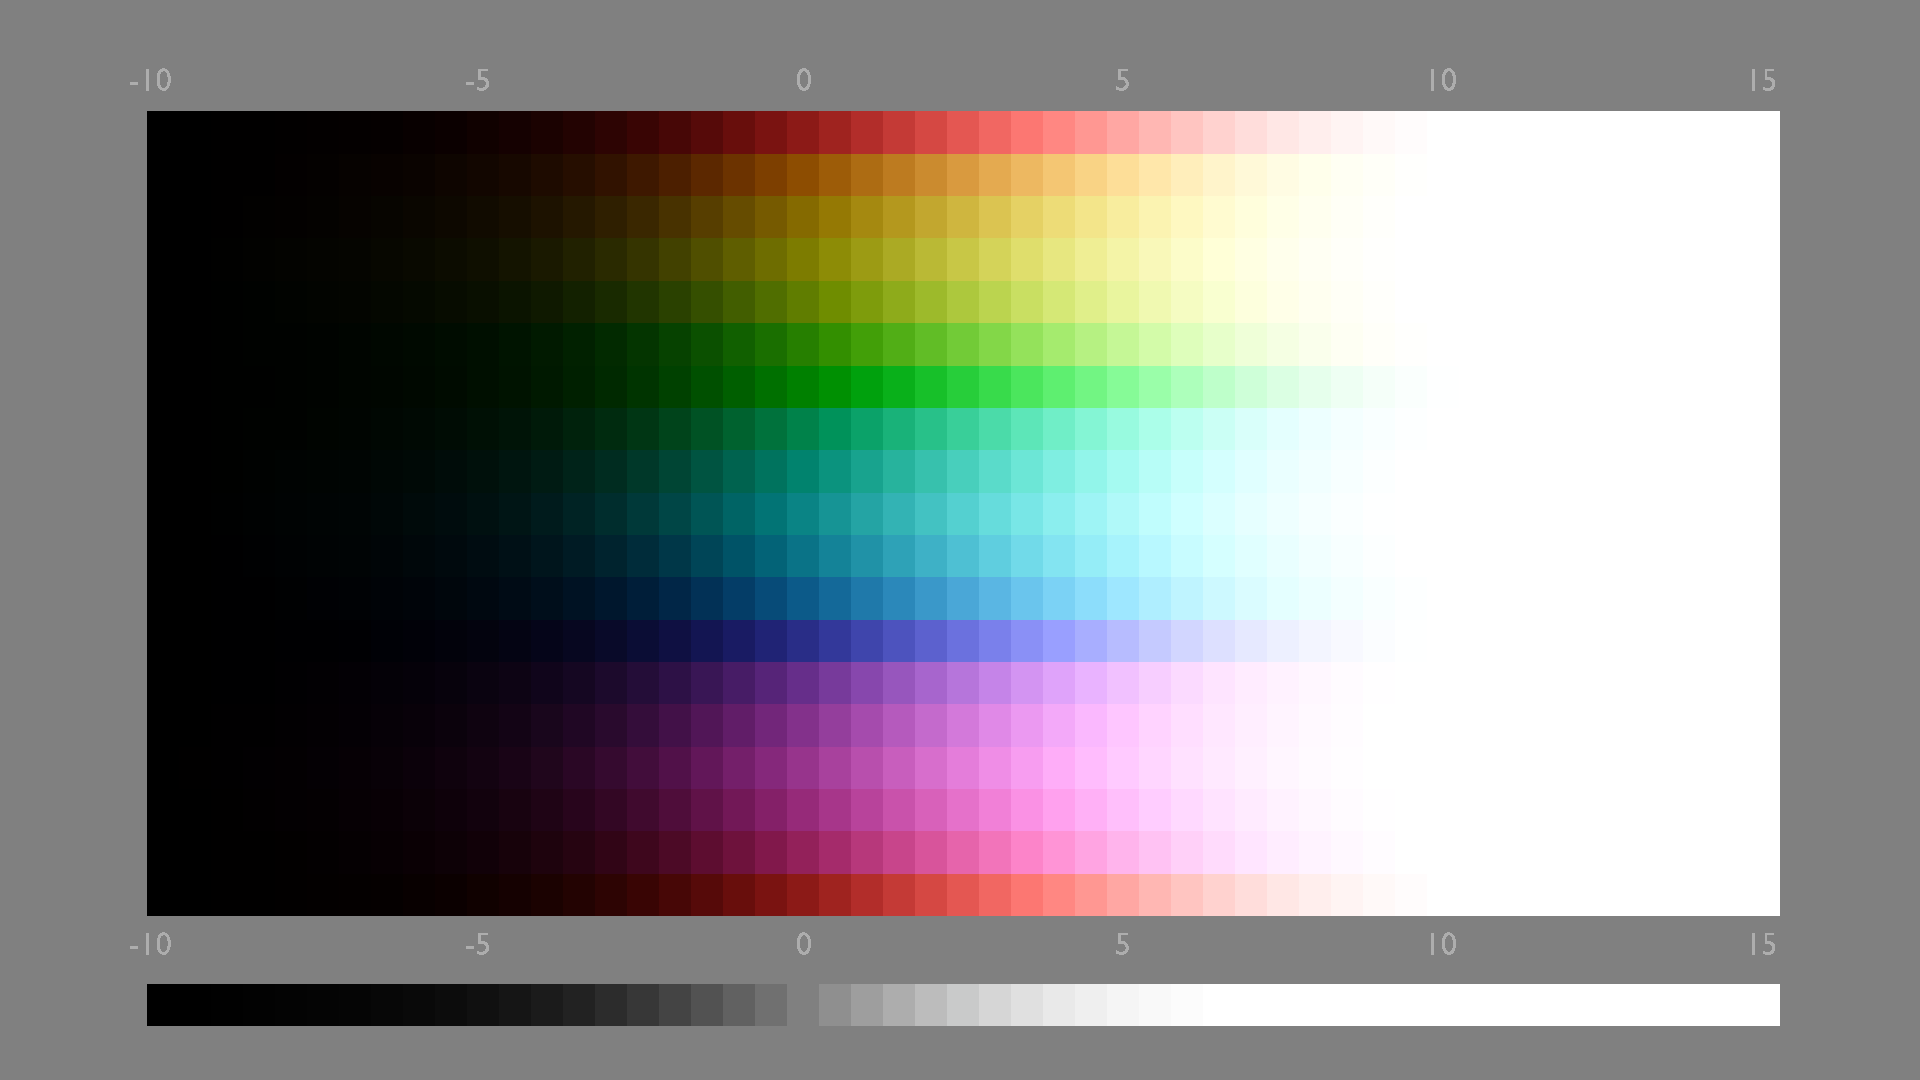
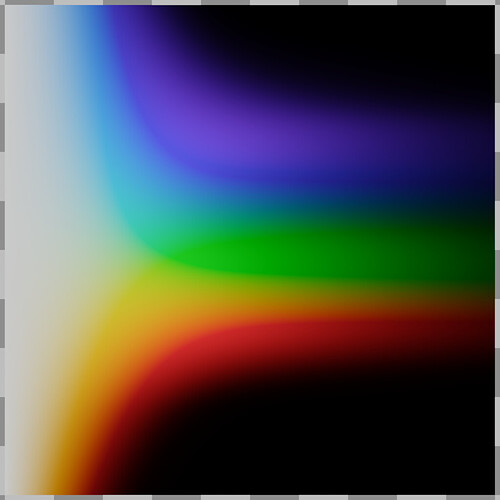
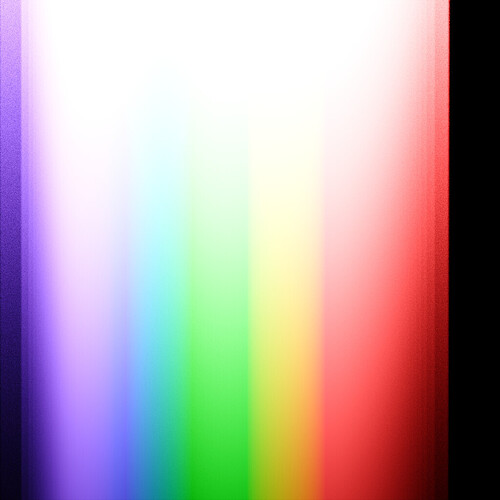
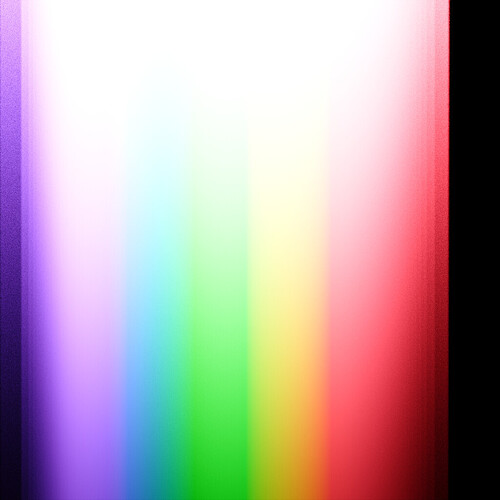
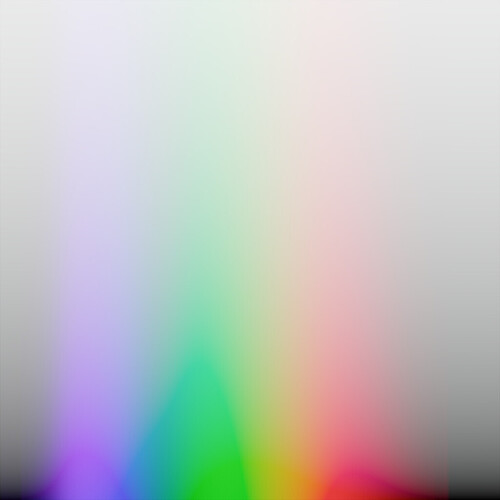
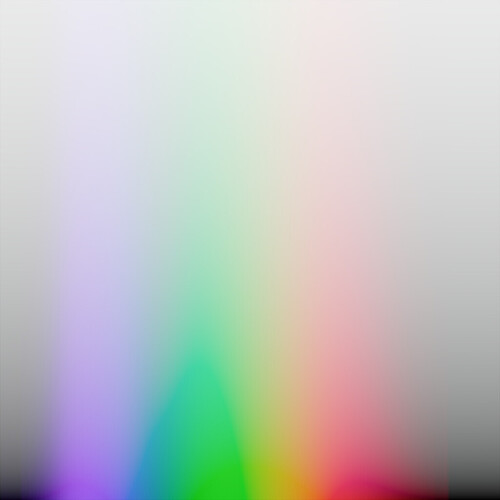
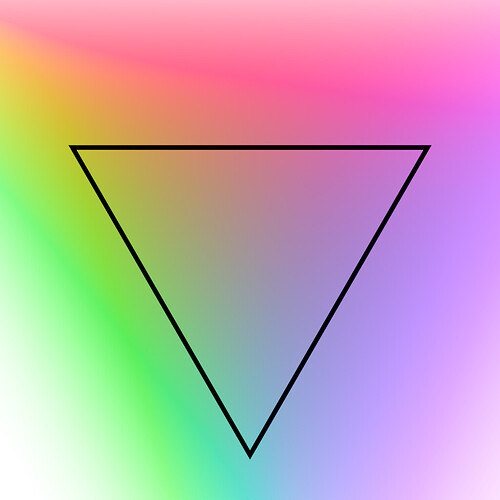
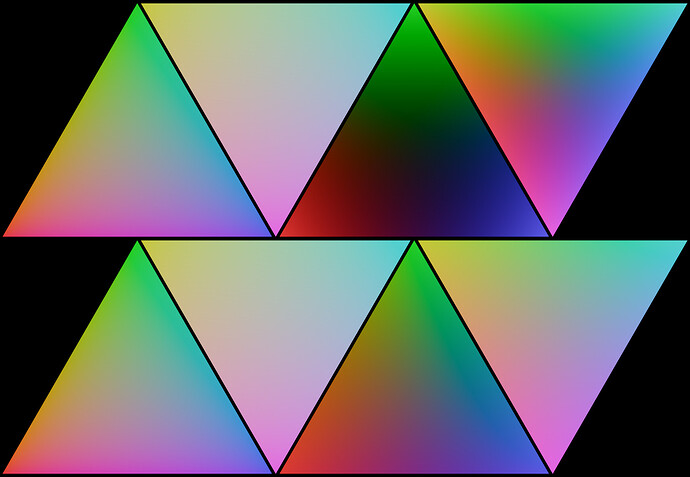
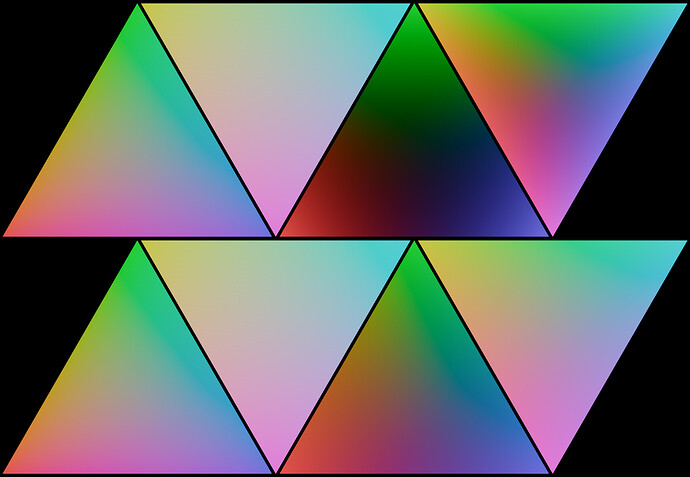
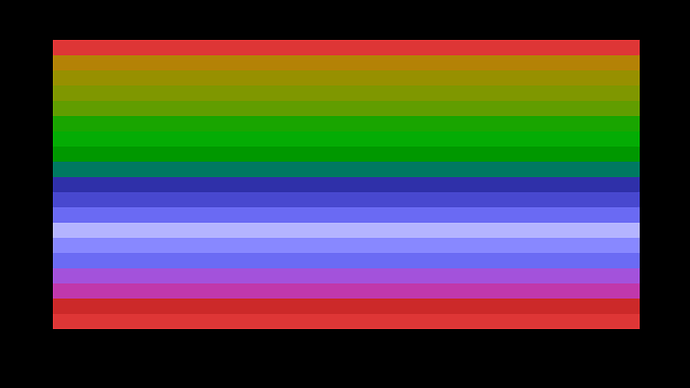
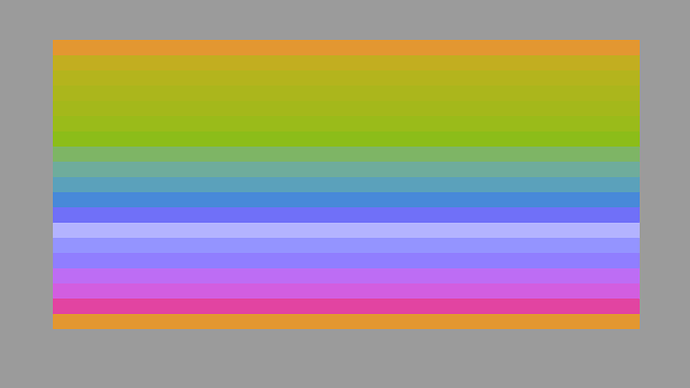
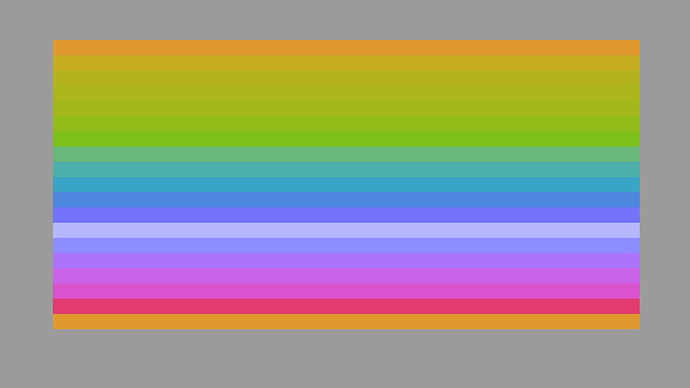
I used XYZ as file encoding when doing this so I guess it gets clipped to the XYZ wall (because Resolve’s plotting tool doesn’t support negative values). Let me see what I can use instead…
Here is with REDWideGamutRGB:
Before compression:
After compression:
I think it’s just what I posted before was clipped to XYZ wall, I think we can see in this updated plot that the part in question also gets compressed significantly.
I can’t quite see why the longer stimulus isn’t being pulled toward achromatic? It seems to just sit in the origin position?
Could be that the part is lower in intensity so it’s not being compressed the same way? @kram10321 what do you think? My guess is that maybe a flat multiplier would compress everything the same way, while the curve compresses things based on the intensity, but need to @kram10321 to be sure.
EDIT: Here is the comparison with 5 stops of exposure boost:
Before Compression:
About the same as what was posted before. But still a little different though, I wonder why.
After Compression:
It does seem like the current compression has to do with intensities.
Those tristimulus values that clump in large numbers outside of the working space will most certainly lead to visible appearance residuals.
So if the spherical compression is doing a solid job of bringing the negative lobe luminance values into the working space, it will need some parametric control to pull various regions toward achromatic as well.
Perhaps a “tension” around the perimeter so that values can be nonuniformly pulled toward achromatic? Not sure!
I see a pretty straight forward way to make absolute luminance matter not at all, and reduce it to just relative luminance. I’m not sure yet whether it’s actually sensible though. I suppose I’m gonna have to try.
Simply add a transformation step: before taking out the grey axis, normalize XYZ and remember the normalization factor for later.
I.e.
# get the radius (relative to black)
R = sqrt(X² + Y² + Z²)

# normalize with respect to black
Xn = X / R
Yn = Y / R
Zn = Z / R

# get the achromatic axis (relative to I-E)
m = (Xn + Yn + Zn)/3

# center with respect to achromatic
x = Xn - m
y = Yn - m
z = Zn - m

# get the radius (relative to achromatic)
r = sqrt(x² + y² + z²)  # this is the new spherical saturation

# transform the radius as desired
r' = f(r)  #  transformation

# transform the chroma coordinates by replacing the radius
# by the way, this bypasses the trig-stuff.
# Since we are not interested in modifying hues, this works fine (same result)
x' = x * r'/r
y' = y * r'/r
z' = z * r'/r

# reverse the achromatic centering
Xn' = x' + m
Yn' = y' + m
Zn' = z' + m

# reverse the luminance normalization
X' = Xn' * R
Y' = Yn' * R
Z' = Zn' * R
I’m very unsure that this is particularly meaningful as it really collapses the space a lot. In fact this would mean the transform no longer happens in the open domain. But in principle, that’s the way to do it, if the goal is to affect all luminances equally. By forcing them to be “seen” as equal.
The fact that it’s not open domain that way means different transformations might be possible though.
I also spent some time trying to invert the current spherical transformation and it turns out there is a snag.
I can perfectly reverse values that already got compressed
But if you try to simply uncompress values that weren’t previously compressed, for sufficiently large chroma, you can end up going into negative territory in log space, meaning if you attempt to invert it to lin space, not only are you not going to get positive XYZ values, you aren’t even going to get real XYZ values.
Quite unfortunate but that effectively means this spherical saturation probably can not be used freely in reverse. It takes specific situations in which it ought to work. - And I’m not sure whether the AgX transform happens to appropriately preserve this. I’d have to look into when exactly it can work. But it’s tricky.
It basically amounts to, if you scale up the radius to be larger than the achromatic axis (the mean value of XYZ), then it’s possible that the value remains negative even after adding back in the mean, which means you can’t undo the log transformation.
I tried the normalized luminance idea real quick and it’s certainly interesting. Using the same curve (which is perhaps a bit naive, as the domain is completely different), it ends up starting to desaturate a bit sooner, but not desaturating as much overall. I’ll have to give some thought on what a more sensible curve for this variation might be.
curve without luminance normalization
curve with luminance normalization
On Matas these particular settings don’t do well anymore. It’s gonna need to be more aggressive for sure (I’m still using the 90 80 curve)
without normalization
with normalization
Here is a much more aggressive 70 50 curve (the value at infinity usually barely matters by the way. The value at 1 is far more consequential.)
The maximum effective saturation I get this way is whenever a color only activates a single XYZ channel. (I think in practice no such color exists? But it’s still useful to think about as that’s the domain of possible-in-principle values)
such a value would turn into a vector (1,0,0) or equivalent, and then go down to (2/3,-1/3,-1/3) after removing the mean. That’s the very extreme of the range, corresponding to a an effective maximum luminance-normalized saturation of sqrt(2/3), so 0 - sqrt(2/3) should be the domain of relevant ranges.
Except if negative values are allowed:
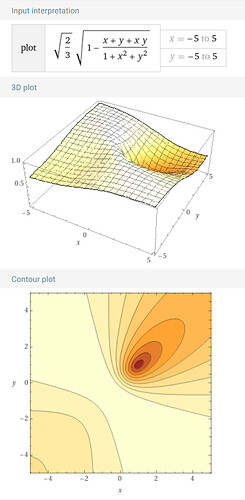
It’s kinda difficult to visualize this, but here is an attempt:
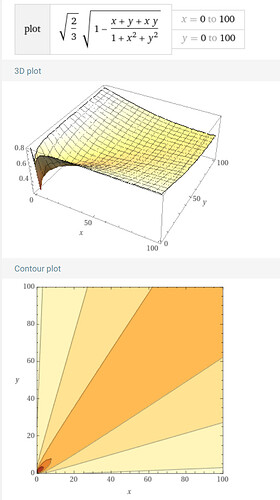
I arbitrarily took Z=1 and looked at how various X and Y values affect the resulting luminance normalized spherical saturation. It’s a pretty complicated curve.
The dark spot is at X=Y=Z=1, i.e. achromatic. It goes to 0 there.
Turns out there is a pretty wide field of values where this Saturation ends up being 1, namely for X + Y = -1
so really the highest values are gonna happen for X + Y + Z = 0 whereas the lowest values happen for X = Y = Z.
For allowed values, the only situation where X + Y + Z = 0 happens to be X = Y = Z = 0 where this is a moot point.
In the positive range, it looks like it really never exceeds the sqrt(2/3) (which is about 0.8165)
You can see that here:
This has an interesting implication:
If we cap this luminance normalized spherical saturation at sqrt(2/3), it will automatically take care of all negative values. Guaranteed.
Here is Matas with a simple sqrt(2/3) multiplier:
vs. a just slightly more aggressive 80% multiplier in the non-normalized version:
EDIT: Sorry no, that’s not quite true. I missed how, for very large negative values, this saturation measure falls again. In fact the lowest possible negative value happens to be sqrt(1/3) which is just half of the maximum value for positive XYZ, so it’s totally possible to have negative XYZ under such a constraint. That said, I suspect such extremely negative XYZ are gonna be rare. The only question is whether the values are usually mapped towards the right direction… I’m not sure how to easily see that. It’s gonna come down to visual tests I think.
Hmm I am not keeping up, what is the problem we are trying to solve with this?
Hi folks, I have been eagerly following this thread as I’m interested in improving display transform options for darktable. I’ve prototyped an implementation of the AgX approach there, and now this saturation compression you’re exploring seems very interesting. I managed to implement that as well (although a bit modified, assuming I-D65 white from the beginning instead of I-E).
The spherical compression in XYZ indeed seems to have the desirable effect of bringing up the problematic very saturated blues / purples that give negative luminance values. But having the compression factor depend on the distance from pixel XYZ to the “achromatic XYZ” indeed implies a dependence on intensity. I was just wondering if one could still do the spherical compression (not normalizing the XYZ coordinates) but have the compression factor depend on the “saturation” calculated on the xy chromaticity, i.e. sqrt(x² + y²). Otherwise just like @kram10321’s initial formulation of the spherical compression, only changing the parameter used to calculate the compression factor, i.e. r_new = r * f(sqrt(x² + y²)) where r is the distance from the projected achromatic value (X + Y + Z) / 3 as explained in this post.
This would most likely make the compression more uniform in the xy chromaticity plane - the question remains what kind of compression curve would be required for that, and if it still has enough of the desired effect of bringing up the negative XYZ values. I intend to explore this path soon ![]()
the problem of “lagging” or “sticking” values which remain overly saturated with the current approach
Certainly worth a try. This would be a kind of mixed spherical/cylindrical approach. In fact, the change is almost ridiculously easy because I’m already calculating sqrt(x²+y²) anyways. Just plug that into the curve instead of the regular radius.
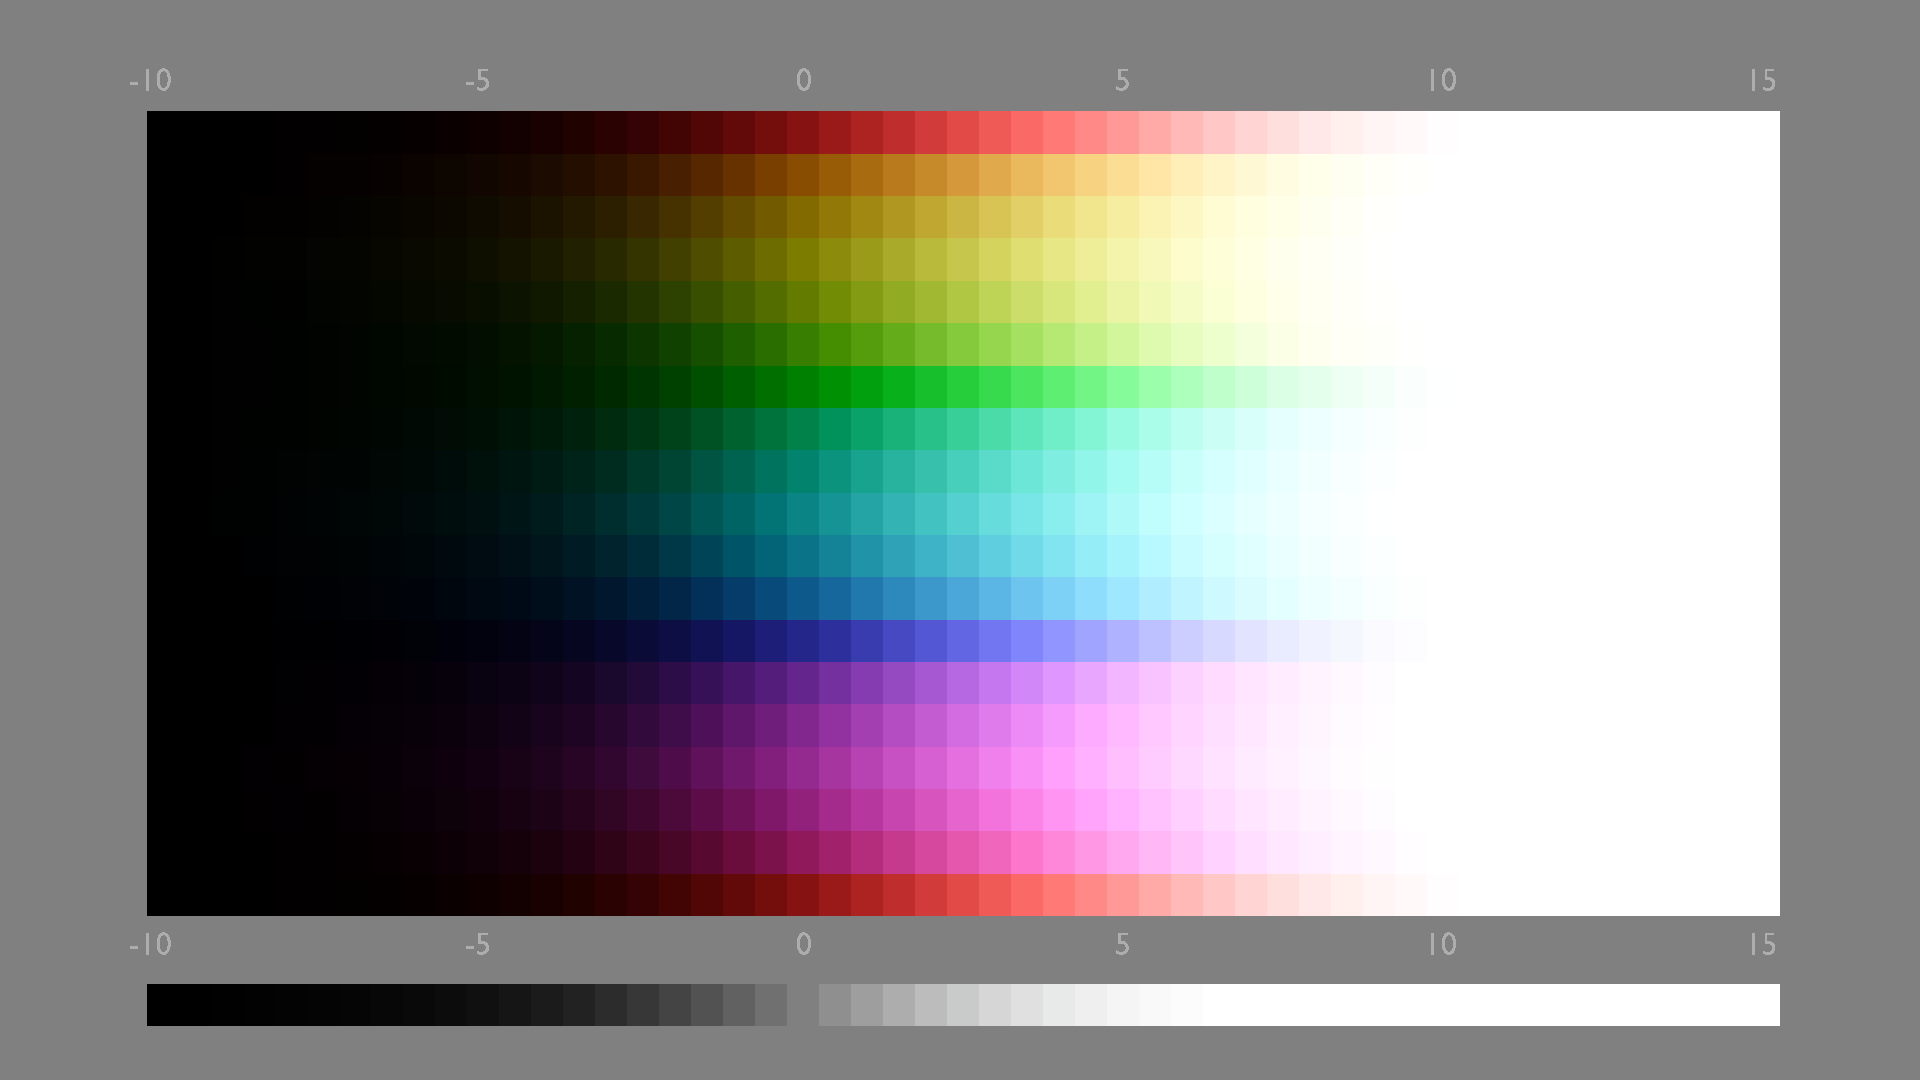
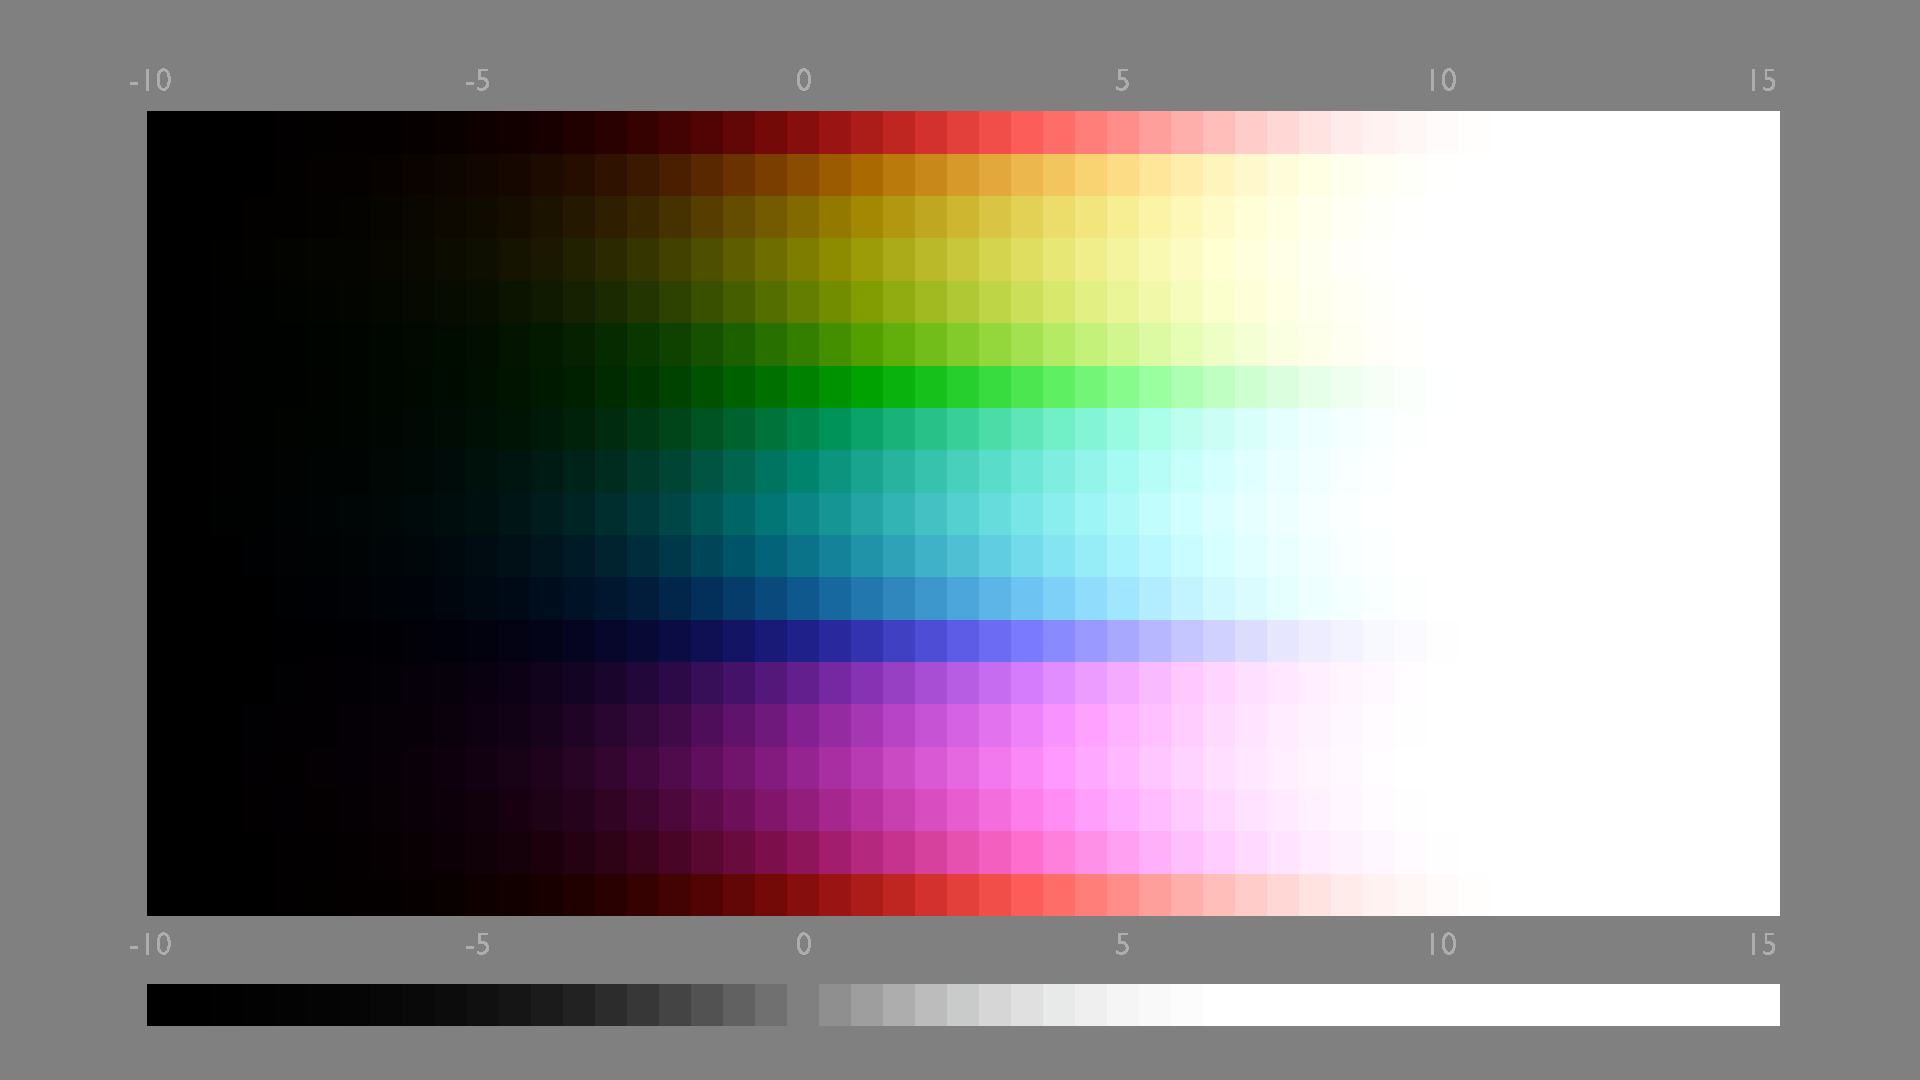
Comparison of approaches: (the curve parameter is always the .09 .08, always AgX Chroma Laden)
unchanged sweep:
flat .80 multiplier:
constant luminance:
spherical:
cylindrical:
And Matas:
unchanged:
flat .80:
constant luminance:
spherical:
cylindrical:
So we already can see that, as expected, there is no artifact with negative XYZ. Will investigate more later. Good start though.
I have been reluctant to say this, but given the explorations in Cartesian spaces, it seems that I should at least mention it.
There is a normalization that is viable here, based on opponency.
That is, we know that the event horizon threshold of the Standard Observer IE model is the locus itself; nothing exists outside of it. Leveraging this, we can formulate an opponency model, where the origin is at 0, 0.
I won’t explain the math, but this works in line with MacAdam’s 1938 concept of an inertial “moment”. The Moment here defines how strong (also seen “chromatic valence”, “chromatic strength”, etc.) a given chromaticity point is in terms of opponency and its ability to negate an equi-luminant sample on the opponent side of a colinear value.
I expanded MacAdam’s Moments to form a continuous 2D plane. The math is very straightforward:
Moment x coordinate: (Sample.CIE_x - Achromatic.CIE_x) / Sample.CIE_y
Moment y coordinate: (Sample.CIE_y - Achromatic.CIE_y) / Sample.CIE_y
This creates a 2D plane in an isoluminant form. This means that an equal radius circle drawn about the origin will yield chromaticities that are, at equal luminance, polarity cancelling for the opponent side.
What does this bring to the table? For starters, this model is vastly closer to how our actual perceptual systems work in terms of opponency, and instead of arbitrarily adjusting “one side”, we now create a tensioned surface of cone responses.
More importantly, given that we know the purest stimulus values are the locus and the purple connective additive mixture line, we can normalize the values such that we end up with an idealized circle of a uniform radius that represents the locus itself.
Given that the Moment calculation can be applied to a generalized 2D projection, this allows us to clearly delineate not only boundary conditions and relative strengths that hold meaning in terms of opponency, but also a mechanism to have constant boundary conditions for all tristimulus spaces as well; they have opponency baked into their constructions!
TL;DR: The approach yields normalized circles that have clear and constant boundary distances.
The process of inversion from a normalized Moment space should be relatively straightforward for the folks here. I believe the results are encouraging, and might be extremely interesting to couple with some of the work here.
Addendum: The normalization is achieved by taking the value in the non-normalized isoluminant Moment plane and simply dividing, yielding a purity of zero to one, relative to the chosen anchor frame, such as the locus itself or any given RGB perimeter.
I should also note that there is a corollary here too. Given that it can be shown that chrominance and luminance are indeed the same plane, we can reproject the 2D isoluminant domain above, to an inverse isochrominant plane. More on that later…
I’ve been meaning to look into Color Purity rescaling. I found the relevant part in the colour-science package so it should be fairly straightfrorward just using the existnig functionality for this purpose.
It’s much trickier to “dynamically” test this though, as I can’t easily access this functionality from within Blender’s compositor. - The ability to near-instantly preview what effects stuff has without having to create a 3DLUT and apply stuff is extremely useful.
This isn’t a true obstacle, just a source of friction to be clear.
Anyway, the relevant functionality seems to be covered here:
https://colour.readthedocs.io/en/develop/_modules/colour/colorimetry/dominant.html
If I’m not mistaken, all that needs to be done is to use the purity functions as a stand-in for Saturation, and rescale based on that.
Curiously there are at least two notions of purity:
-
Excitation Purity
-
Colorimetric Purity
Looks like Colorimetric Purity is just a rescaling of Excitation Purity
Excitation Purity is scaled such that at 0 we are looking at achromatic stimuli, and at 1 we are looking at spectral stimuli. So I think that’s what we’d want?
Not entirely sure what the scaling factor in the Chromatic version represents. It looks like it’d also be between 0 and 1 though, based on the code on that page, so actually perhaps that one works too. Any insights into what’s different between the two? What each represents? Which one’s gonna be more useful?
EDIT:
OK, this is what’s going on here:
If I understand right, Colorimetric Purity essentially exists to fix stuff across the line of purple? - That line, of course, does not represent any pure colors, and as such can’t be caused by excitation through a single wavelength. So I’m guessing that’s where the names come from and Colorimetric Purity is what we want after all
The issue with this is that purity becomes detached from the opponency mechanism. That is, arbitrarily shifting purity one one side will have a rather strong effect on the appearance mechanisms. This is one of several reasons why a normalized opponency space can make more sense.
As above. The isoluminant projection of xy does not encode opponency, without the reprojection I outlined above.
I am extremely skeptical based on plenty of experiments that xy purity will yield anything even remotely fruitful.
As long as one knows that all chromaticities have an opponency combination, the magenta line naturally flows from this. When plotted on a circle, the spectral chromaticities will emerge mechanistically.
With opponent you mean complementary colors?
Something like this?
The natural color system looks interesting,is this the kind of result you want to achieve?
This is a fundamental component of the visual system; any value on one side of the colinear axis through achromatic can have its hue “polarity” negated / neutralized to the achromatic point with any value on the other side. The magnitude of the compliment is the question.
With the above MacAdam moment space, a circle formed about the origin will, at equal luminance, counter the polarity of the other side.
When normalized, this forms a normalized circular model, with a clearly defined boundary condition.
Because yellow is perceptional brighter than blue at the same opposite radius?
But the Human vision luminance sensitive curve is used as before with blue at roughly 0.07 multiplyed ?
Do you have a example of this system,a paper or plots or something?
Ok I think I just misunderstood you then.
It’s easy enough to do the transform you mention,
I think I got this in a split screen here, after adding back the achromatic (so it should, if I got that right, effectively show a constant luminance of 1)
It’s interesting, that the neighourhood of blue looks so weird that way: Light blue ends up purplish, and “pure” (sRGB) Blue ends up almost grey and visually brighter than the others. I’ll just have to think about how to use this now.
Here is, after roughly normalizing, the (spherical) chromaticity this approach comes up with:
The blue line sticks out like a sore thumb. The green line is also rather obvious (although this isn’t the sRGB green primary, but rather it’s the one right below that’s the darkest)
and here is the perhaps more regular cylindrical chromacity
Almost the same, really, except it’s darker overall (this is also normalized though, so that isn’t apparent in the image), and the contrast is lower (green doesn’t go as dark)
Here is the effective Hue of this approach:
And if we were to use the spherical version (which, I think, does not make sense here, but just for good measure), the other Hue-like dimension ends up looking like this:
and normalizing by (cylindrical) chromaticity (so everything is equally saturated) gives this
That looks roughly right to me
If we plug that into the full transform, we get:
barely affecting greens but extremely affecting blues. (Note, I’m forcing a chromaticity of 1 here, and the hues of grey values are ill-defined, and since green is less affected than blue, it’s perhaps no wonder that that’s the hue grey ends up with if you force it to have a saturation. What we see there is probably the hue with the lowest saturation-contribution)
Meanwhile, this is what the Luminosity of this approach comes up with (i.e. what happens if you set Chromaticity to 0):
This will need completely different curves to avoid blue going nearly entirely achromatic.
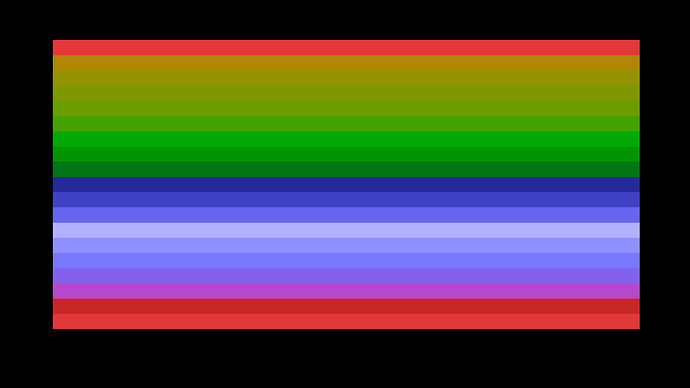
Here is an attempt:
Sweep AgX Chroma:
After a curved chromaticity reduction in this transformed space:
And a bit less aggressive:
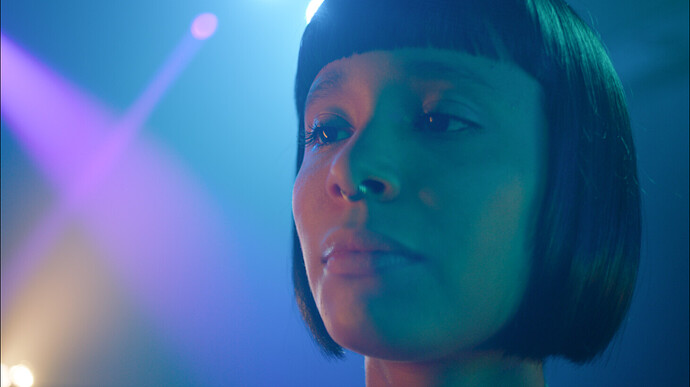
And Matas:
regular
curved (using the less aggressive version)
And xmasRed:
regular:
curved:
It basically doesn’t change at all! The falloff is too gentle in the area that would affect red
Just to show that they are not identical, here is an extremely boosted image of the difference:
EDIT: I think I found a compromise that works for Matas and redXmas. These are roughly the least aggressive settings I could find that give a noticeable improvement on both:
It barely affects sRGB pure green (though the next door neighbour on the yellow side is definitely pushed towards green quite a bit)
It also does an amazing job - perhaps the best yet - on challenging settings such as Blackbody:
before:
after:
or Spectrum:
before:
after:
or Spectrum + White
In this extreme case you can see, that oversaturation in red and green isn’t completely fixed, but the blue side is massively improved:
before:
after:
and the more comprehensive version that only shows colors from within sRGB shows how green really is barely affected at all:
before:
after:
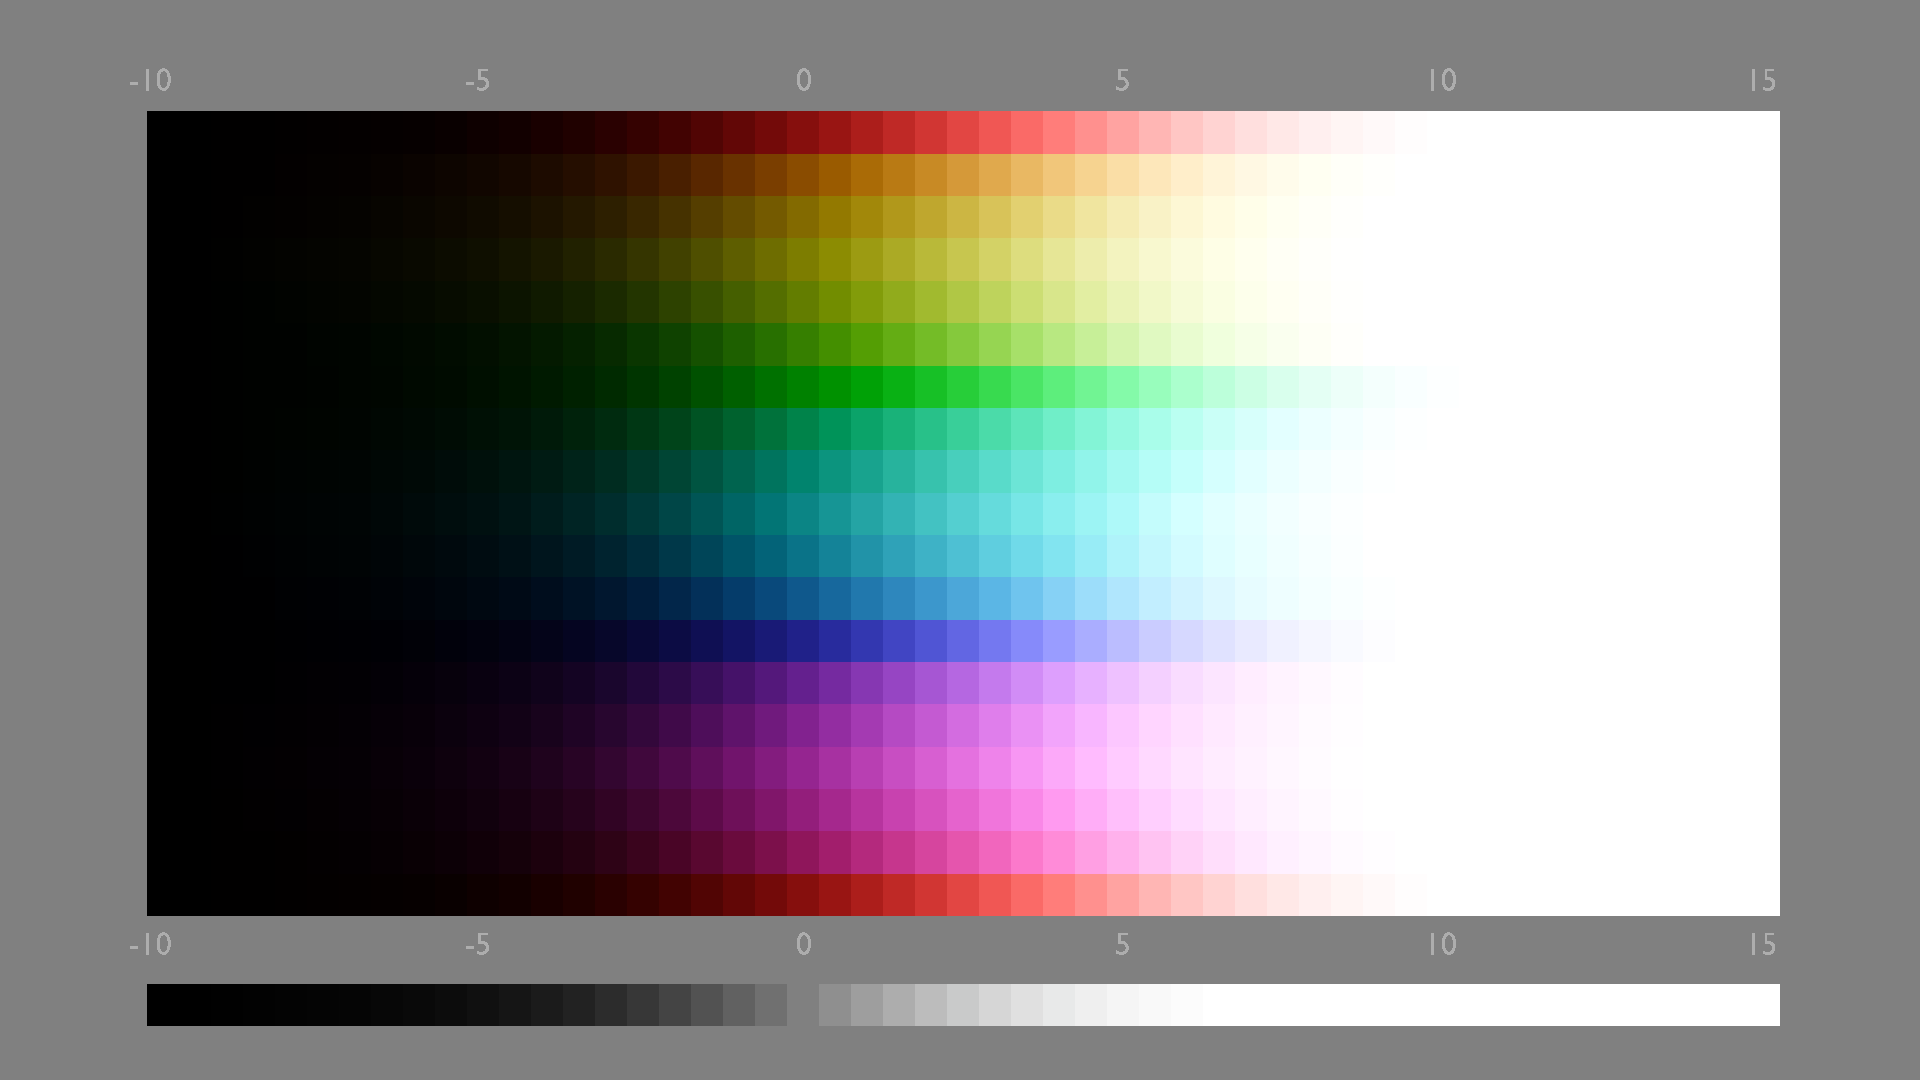
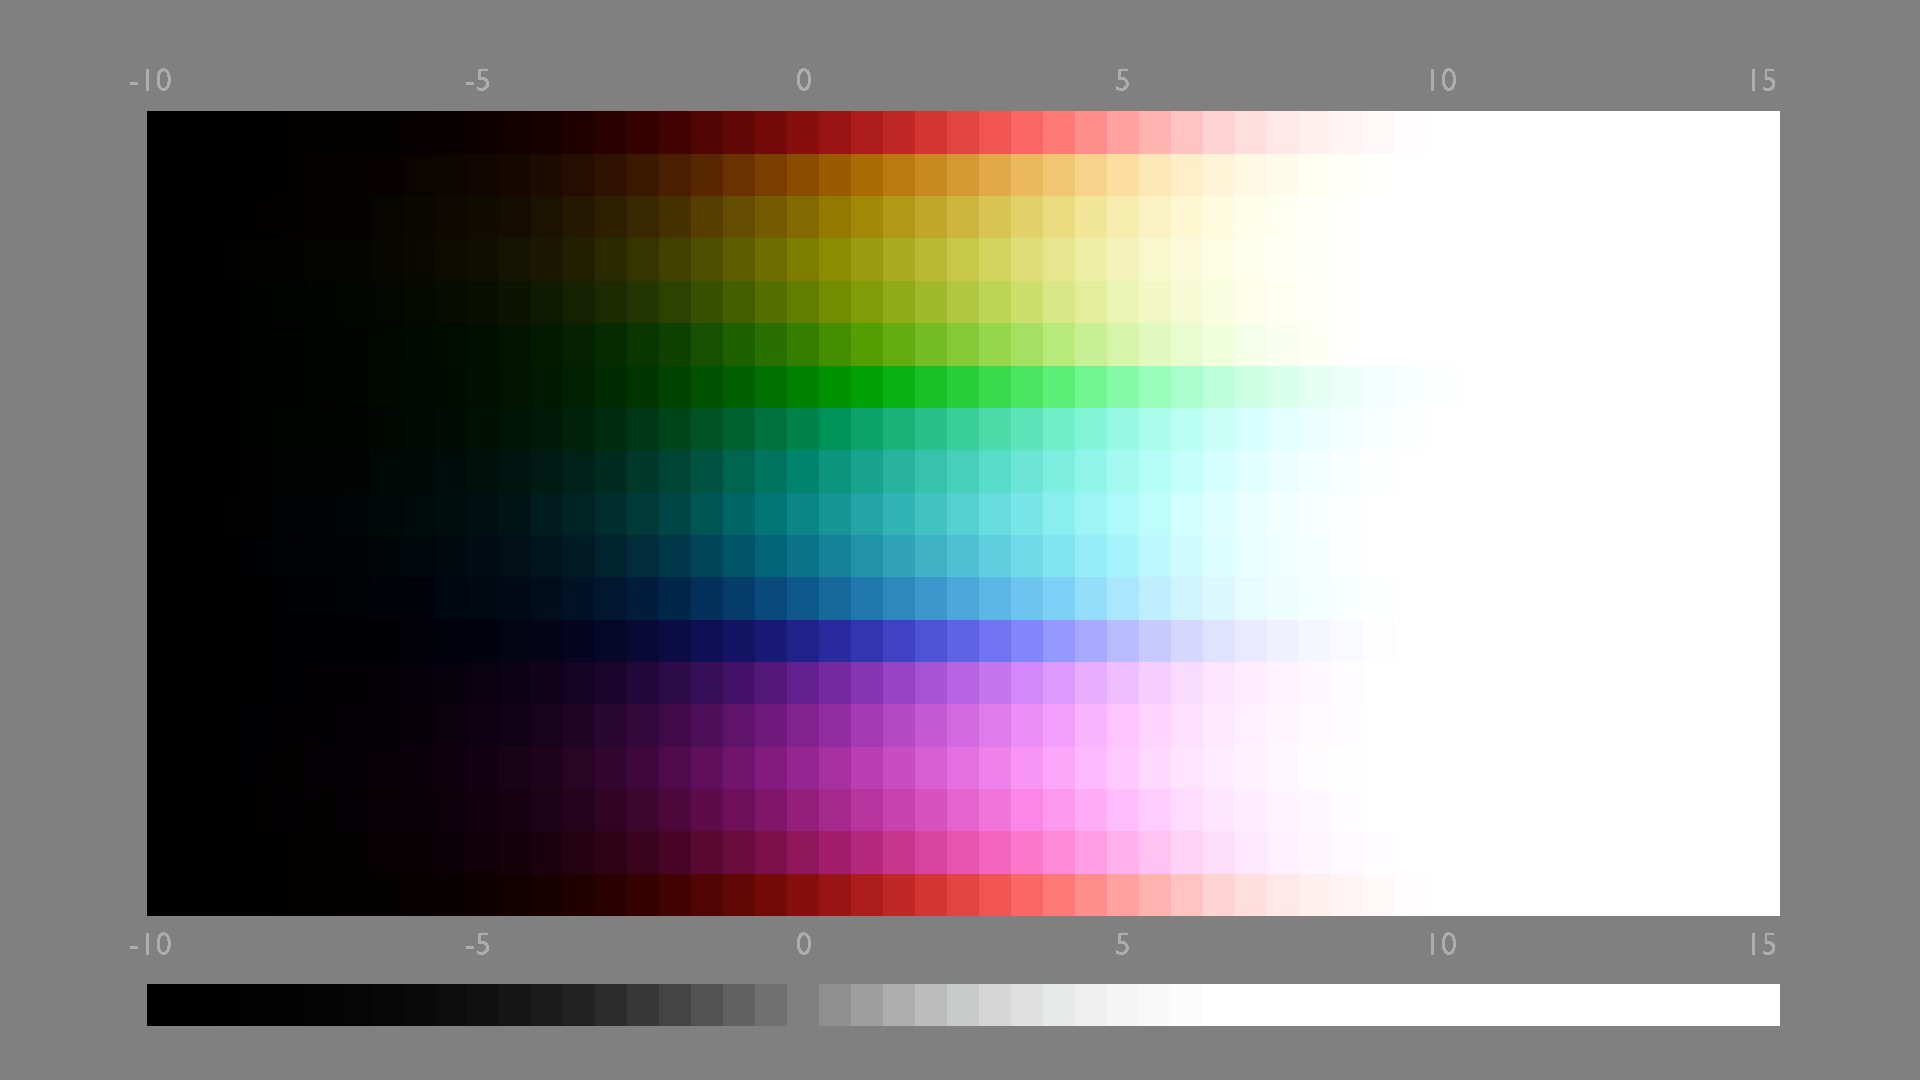
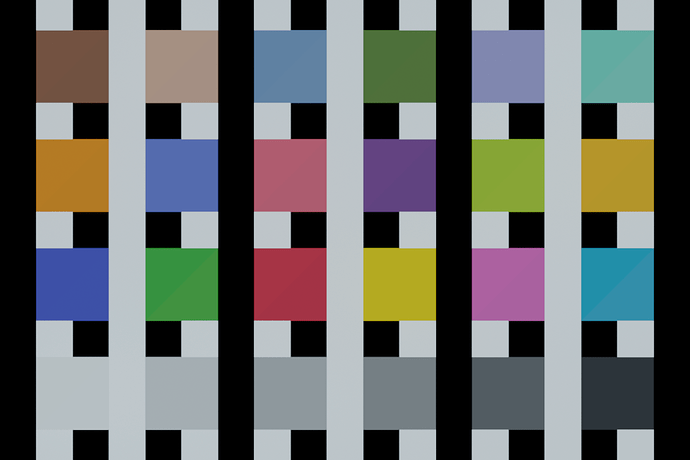
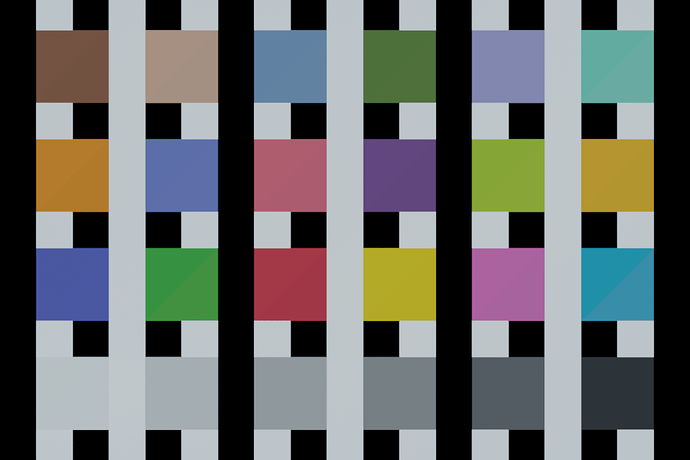
and finally, here are the trusty swatches:
before:
after:
OK I noticed there is a really big difference when changing the Whitepoint. Not that that’s surprising per se, but the issue is, I’m not quite sure what actual whitepoint which image has.
I’m pretty certain the photos ought to be in D65 at the start. But with the spectral renders, it’s gonna depend on how old they are, as at some point, iirc, they got compensated to transform from E to D65 or something.
It particularly matters how greens and turquoises are treated: Sometimes, if you use the wrong whitepoint, they actually get boosted in a transform that supposedly only lowers saturation. Some of that was apparent in the images above. I had to redo them.
This issue may also affect earlier tests. It would be too much work going through past posts to fix that though. - It wasn’t as noticeable with the other transform types, but with this particular one, it’s very obvious.
I’m also not sure what @troy_s’s sweep has as a whitepoint
The projection should yield opponent based values. I do not believe your plot is possible as luminance of 100% is unattainable with any chromaticity purity?
That is, when converted to a Moment projection, concentric circles will negate hue polarity when the two values on opposite sides of the circle are mixed at uniform luminance. This will effectively turn the outer footprint of BT.709’s primaries triangle into a circle.
I would not expect anything like what your demos show, so perhaps you are doing something funky with the “add back”?
The “adding back the achromatic” was done for just that one image, not throughout.
Here is just the output of that transform you wrote, and nothing else:
Since you didn’t tell me which whitepoint is appropriate, here it is in both:
D65
E
grey becomes black because the achromatic is subtracted in your transform.
So I also looked at what happens if I the achromatic back in after the transform. That results in this:
D65
E
If that is nonsense, so be it, but none of the rest of my tests is affected by that
This is an extremely interesting topic. I have stumbled upon it somewhere but never explored in depth before.
This is a good idea, but I wonder it is expected to work. On the opposite side of the Rec. 709 blue primary (in CIE xy chromaticity) (0.15, 0.06) we have a yellow (0.42, 0.51). If these are to reside at opposing sides of a circle in this kind of normalized Moment plane, I am quite confused since mixing these at equal luminance definitely doesn’t yield (D65) white. The way I understood the normalization was:
Given Sample CIE xy, find xy chromaticity of the point at the Boundary (the point at the footprint of the RGB primaries in xy that’s collinear with sample and whitepoint) and its corresponding moments. Then
Moment x normalized = Sample.Moment_x / sqrt(Boundary.Moment_x ^ 2 + Boundary.Moment_y ^ 2)
Moment y normalized = Sample.Moment_y / sqrt(Boundary.Moment_x ^ 2 + Boundary.Moment_y ^ 2)
But perhaps I understood something wrong!
