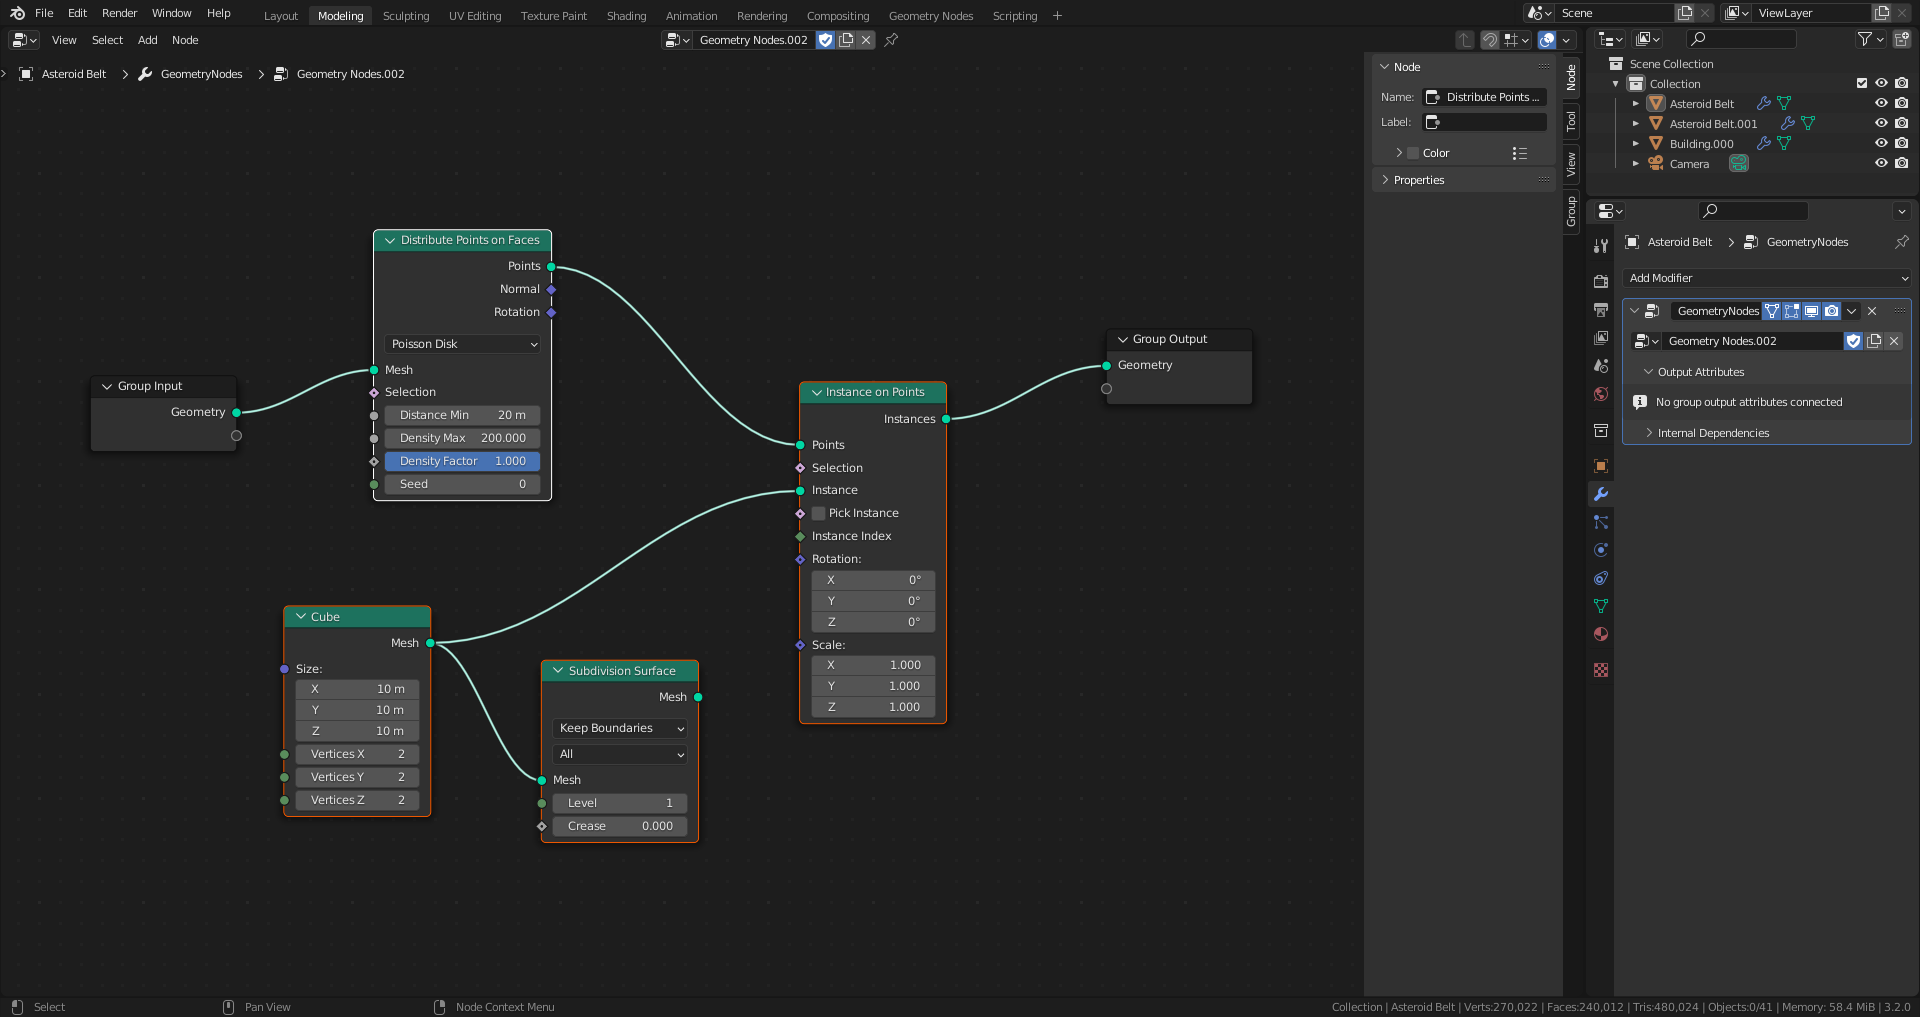
I have a scene that seems fairly basic. Its an architectural visualization of my house, and I’m trying to fill out the yard with grass and vegetation using geometry nodes. Here is the geometry node set up.
The grass is just planes with image textures that I added through BlenderKit.
When the geometry nodes are active Blender is basically unusably slow. I’m not sure if its my system, the geo nodes set up, or something else.
I’m on a macbook pro M1, with 16 Bg of ram.
I would upload the blend file but its 1GB, which could be part of the issue. I am using a handful of BlenderKit material
It’s hard to tell from there, but if you got too many instances the viewport can be hard to navigate.
That won’t be an issue for rendering. There is a node called “is viewport”, you can use it with a switch
set to float to enter 2 different values , depending on if you’re rendering or in viewport. So a low density for the viewport in the distribute point node.
Try to disable the instances or the geononde modifier and if viewport is smooth again then you find the culprit !
Protip: If you are rendering this with Cycles it will do it faster if you go for higher poly meshes instead of planes with alphas. Also with alphas you risk of getting black spots when the ray depth ain’t high enough, and when upping that ray depth you will get even longer render times.
Tldr; Cycles don’t like alphas
Thank you for the feedback. I was instancing grass objects that were made up of planes with image textures, and swap those out for actual meshes, but that hasn’t helped anything.
I’m still getting this even when I lower the density on the distribute points on faces node to a very low setting. Is my system just not equipped to handle this type of thing?
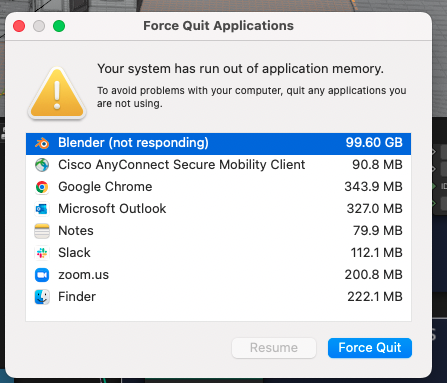
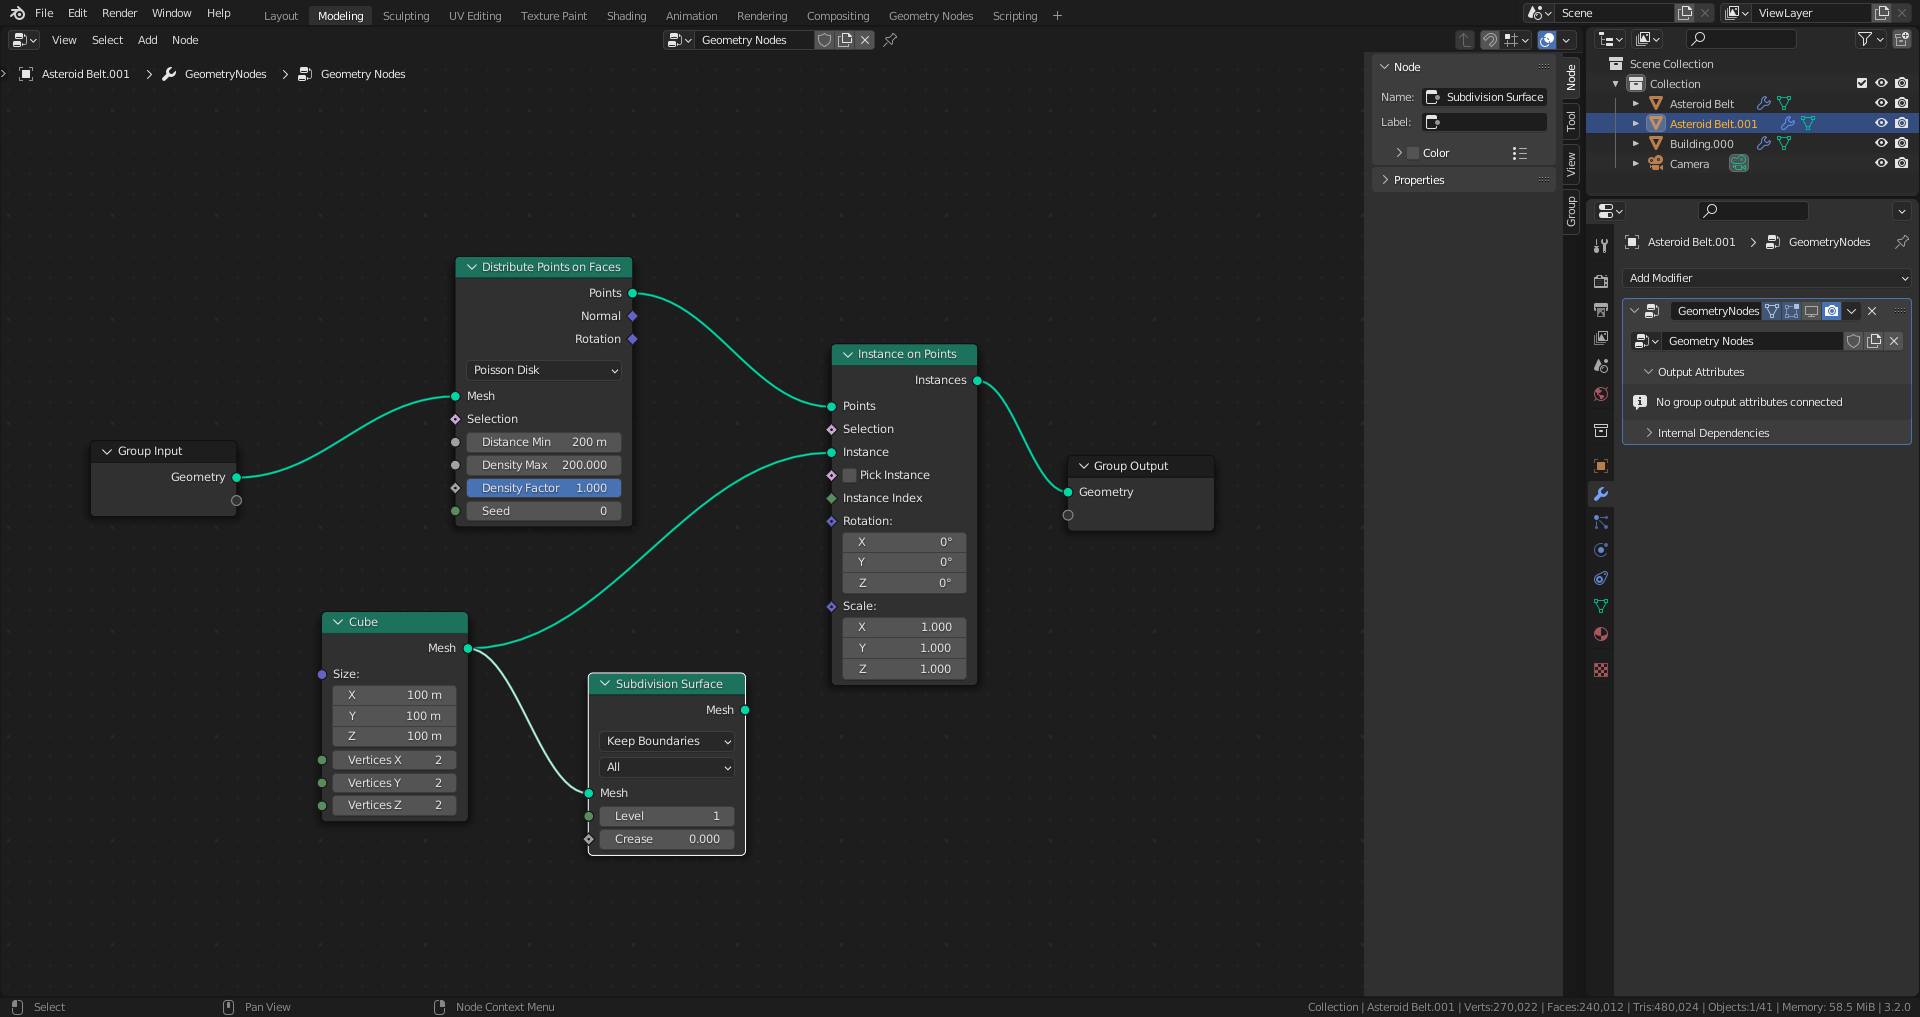
The big plane is 3000 by 500 meters, the small is 300 by 50. Any change I make to the geometry nodes of the small plane, including turning on the display modifier in the viewport happens right away, or about half a second. If I do the same thing on the big plane, I end up with blender becoming unresponsive for about a minute. I’ve checked my task manager, and whenever blender becomes unresponsive, memory use goes up to like 16.5 Gigs.
Seems to me like the only way I can do my scene is if I create i really tiny world with really tiny objects, or, I can just use the particle system.
Note: If I scale the small plane by 10, it’s just as responsive as the unscaled version, it’s a possible hack for my problem.
@sozap
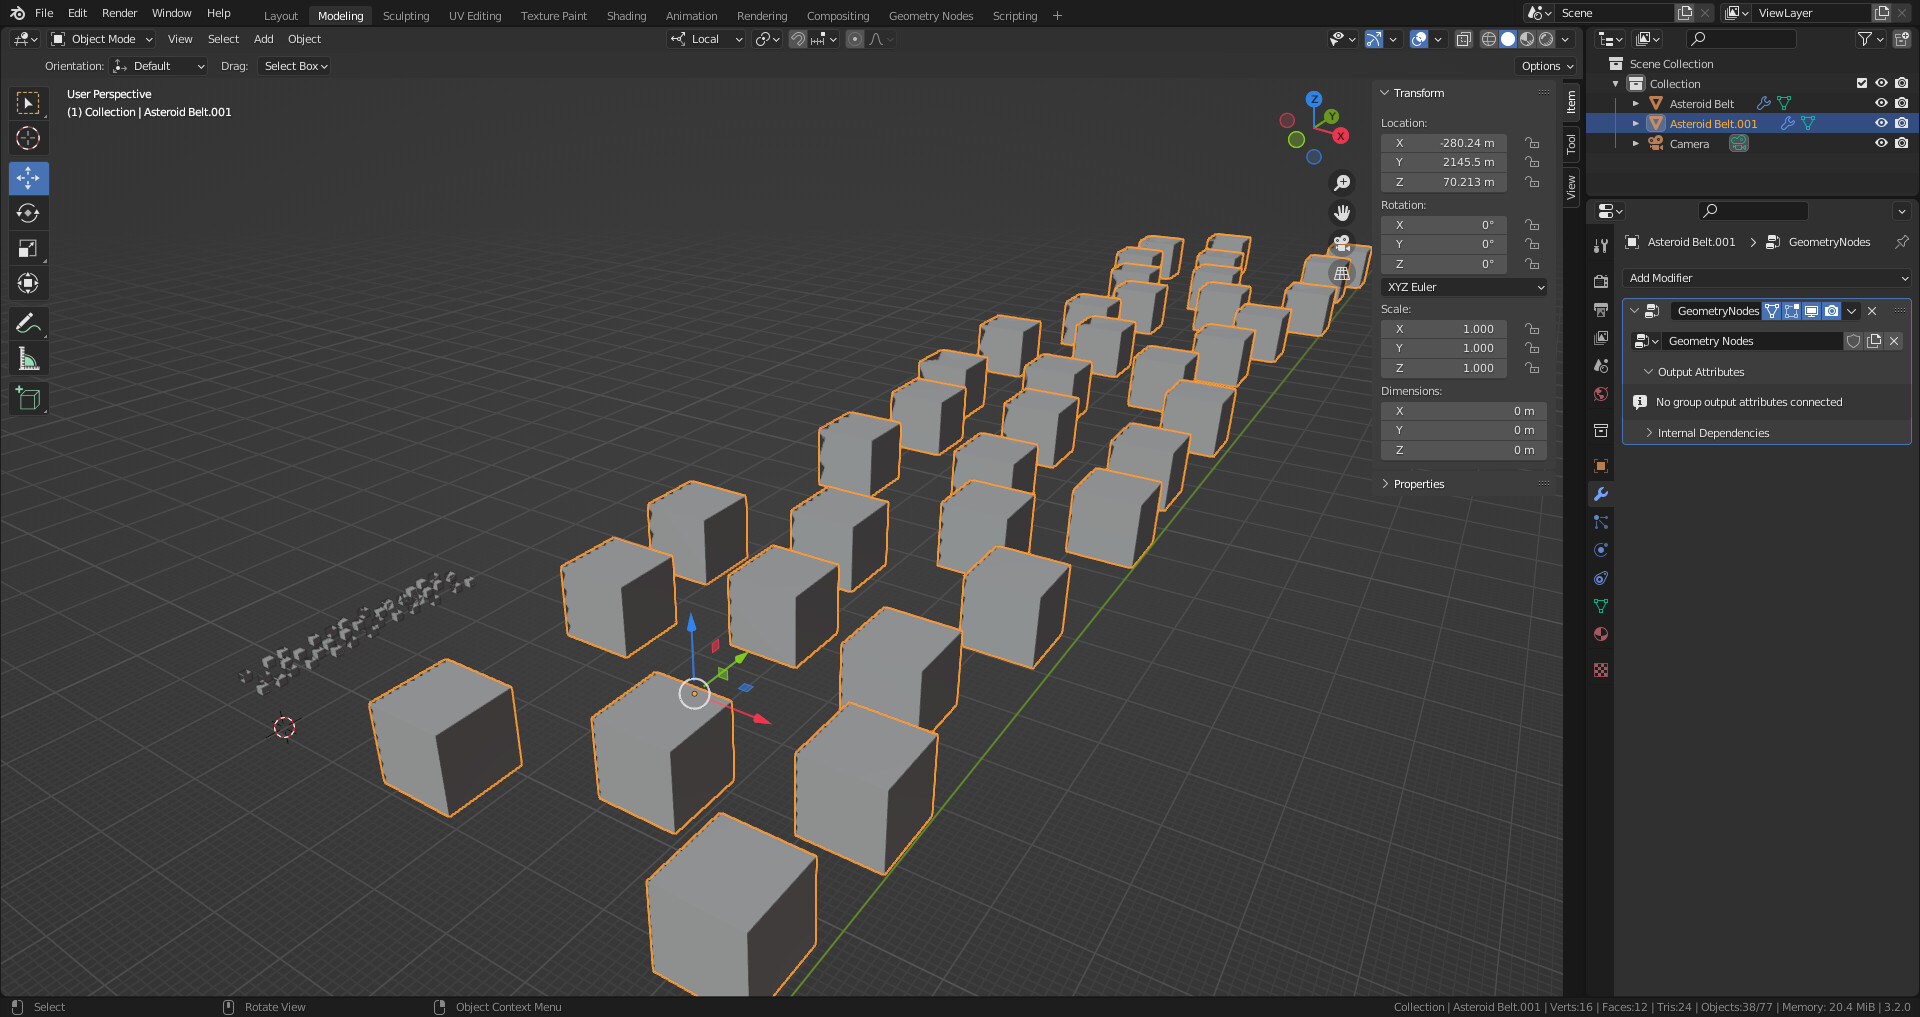
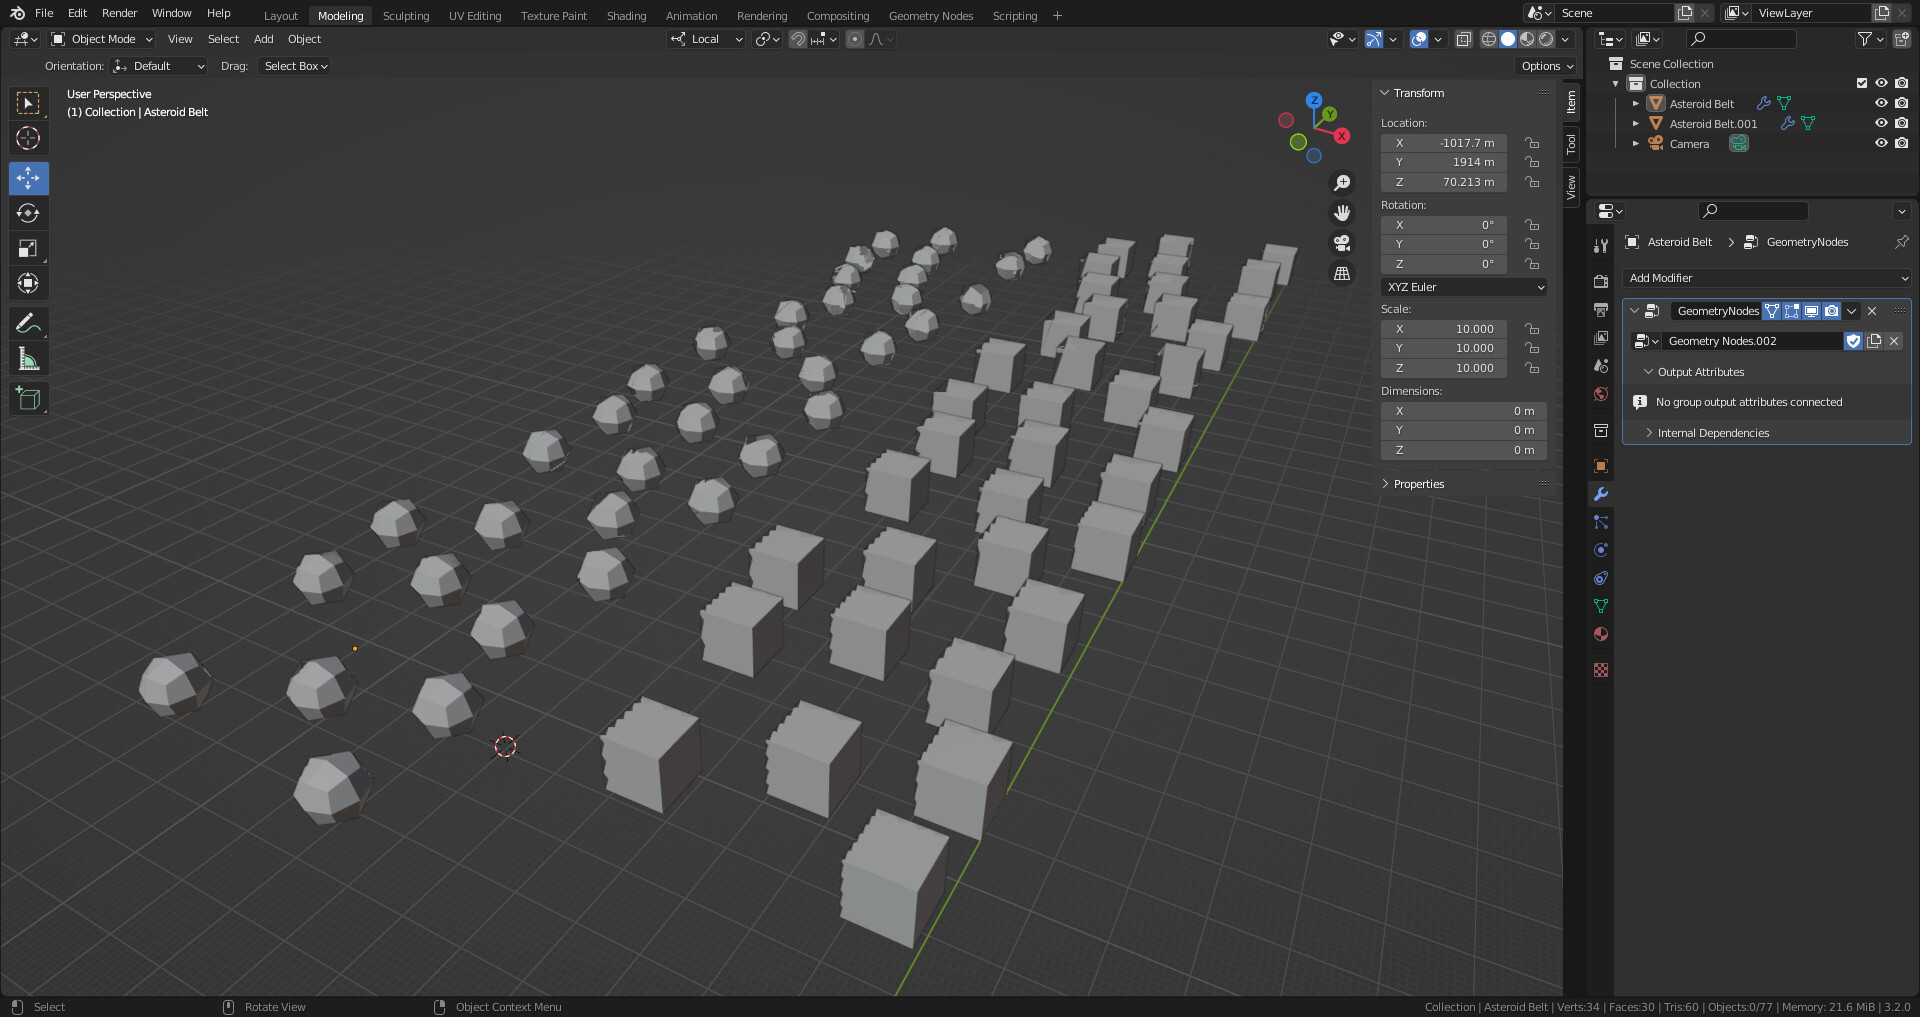
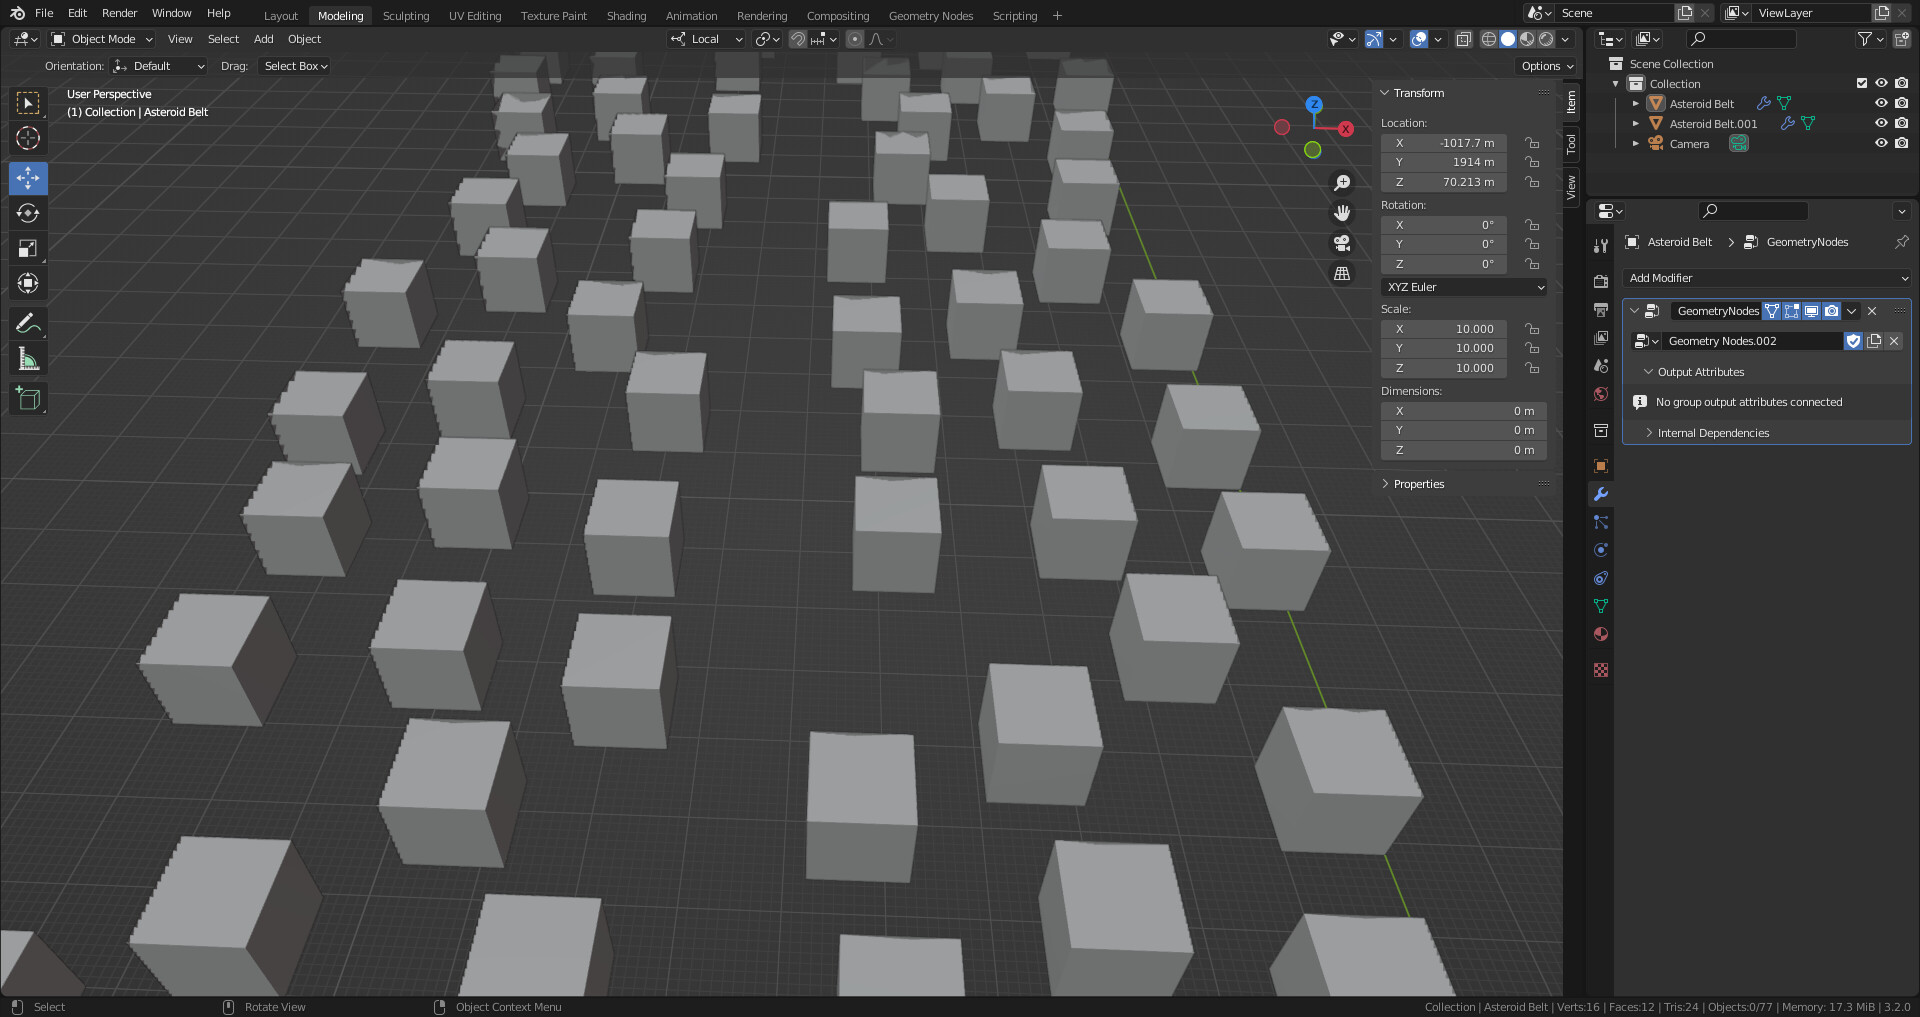
When I open my file and viewport is active for the large plane, it freezes blender the same way as it does when I turn it on. Here is a screen shot with more comparable objects, as you can see, both objects have the artifacts, but only one of them causes lag.
As for my video card, I have a gtx 1051 and a rx 580. I tried switching my viewport to the display connected to the gtx, same issue. Once the freeze period is over, I can navigate through the viewport with no problems, as long as I don’t change anything in the geometry nodes that changes anything.
That’s weird, in theory the scale shouldn’t be relevant, only the poly count / instance count.
But that said, the cube version shows drawing artifacts ( all edges/faces should be sharp) , something may be wrong with your GPU.
In any case you can try to adjust the viewport clipping to fix this, but once again, it shouldn’t affect performances.
It’s worth checking if these issues happen right away when you open blender and load the scene,
Or if the memory increase while you work. That would mean a particular bug.
What append if you apply the modifier ? still buggy ?
I believe Eevee is doing some light culling/optimizations behind the scenes when it comes to alpha masked objects, likely drawing them with less fidelity the farther you are away from them.
There’s been more than a few times that I’ve seen the viewport go from perfectly performant, to chuggy mess based upon how close I’m zoomed in to a dense set of alpha textures.
You may try to disable completely one graphic card, and test each one.
Hard to tell what blender is doing here. And which GPU it’s really using.
But it may not be related to that.
I think blender is always using one GPU, unless you’re rendering with cycles where it supports multi-GPU.
The artifacts may comes just from camera clipping.
It’s ok to have similar slowdows on big scenes, I think the GPU as a way to minimize it’s power , so before it start to use full power you may have some slowdowns and then it gets faster.
But , your scene seems really simple unless there is an hidden thing. There is now way it can use so much RAM, and introduce such slowdowns. But I may be mistaken.
Maybe try the hardware ( both GPU separately ) to be sure it’s not related to that.
Or share the scene so someone can have a look at it.
I would consider this a software problem, also not really related to my GPU, but rather my CPU usage. My guess is that someone has made some kind of programming mistake. I mean, seriously, 16.5 Gigs to display 30 to 40 cubes with no modifiers, and no, nothing is hidden. As for my video cards, I would rather not mess with them.
I ran my GPUZ and found no GPU activity during the crunch time, both my GPU’s were at 37 degrees or so, my CPU temp went up to about 50, which isn’t too high. Also I created another plane, but instead of 10 times the size I made it 5 times: Like the other one, the CPU use goes up to about 13%, but it used 4 Gigs max, and took about 20 seconds. Feels like maybe someone is using a bubble sort where they shouldn’t.
Yes it’s likely to be a bug !
But in order to be helpful we need to find the exact culprit. Then with these information we may submit a report.
Can you share the .blend ? I’ll try on my PC and see if I find something.
To disable the GPU, I think you can try to unplug one screen and restart the computer.
I get the logic, if it was GPU related why it messes with the CPU ram, indeed…
Maybe someone with better experience can shed some light on all this…
Try to reduce the density max from 20 to something like 0.01 in the distribute point node.
It’s related to the way that node is working internally… it first create some points based on that density factor. Then eliminate points based on the distance min.
You’ll see that by setting density max to 0.01 and distance min to 0 you already get quite a bunch of points.
Density max to 1, it’s still manageable but it’s quite a lot.
if you set it to 20, my guess is that it create quite a huge amount of points and that operation took a lot of memory even if the result is only a few points.
Try that first and tell me if you’re still having issues !