In 2.7x, when you use viewport preview rendering, there is a helpful little display at the top left corner that shows, among other things, how long the last viewport update took to render.
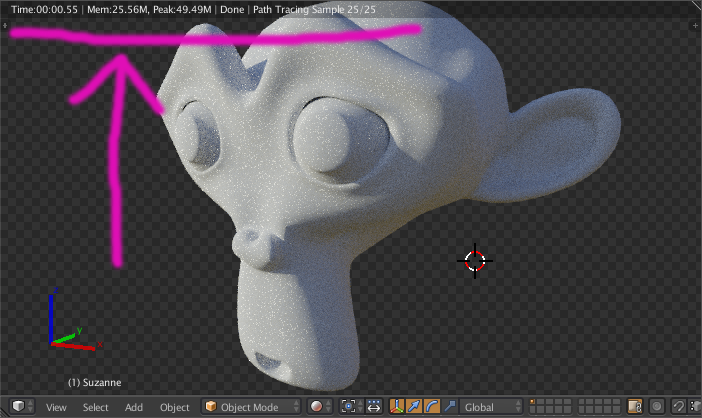
In 2.8, I don’t see anything like that in Eevee. I see something like that in cycles, but it does not display the render time.
Is there a way to get that back? Especially in Eevee, where I’m still figuring out what even affects performance. I mean, if I can’t, then oh well, but I’d really like to.
This feature was incredibly useful. The main way I used it was adjusting things like material settings/nodes and seeing the effect those changes had on the render time. I mean, I could make a change, do a test render, make another change, render again… or just move the viewpoint around and see if it feels laggy.
It was massively more convenient to mute/unmute a node (or something) and just watch the timer automatically update. Especially if it was a small sample of something that would be resource intensive. Watching a small lock of hair’s render time go from 2 seconds to 4.5 seconds is a lot easier than rendering the full thing and seeing that the time goes from 2 minutes to 4.5 minutes.