All,
I’ve recently started dabbling in Blender to do some scientific visualization, like ParaView but 1000x prettier ![]()
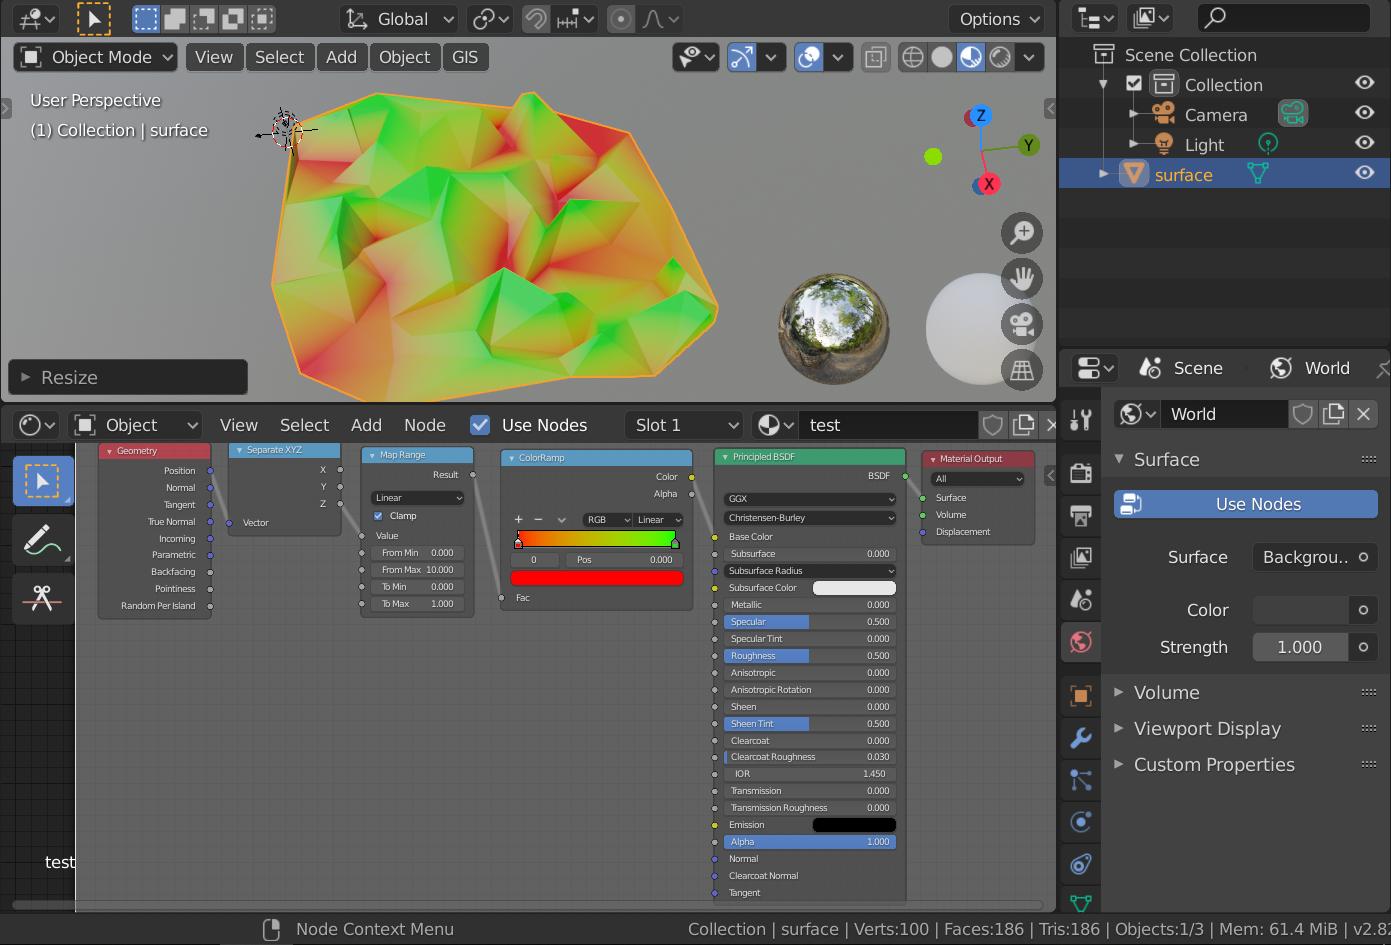
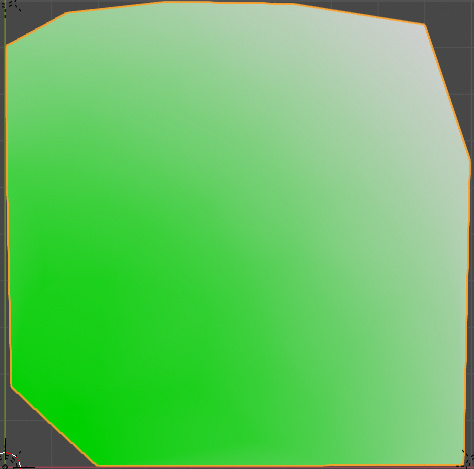
At the moment I’m trying to tackle adding a color ramp to a 3D surface. As of now, I’ve been able to figure out how to use the surface’s vertex geometry as the input for coloring. My current node setup looks something like this:
This separates the z-values from the geometry and uses them as input for the color map (after normalizing them in the map range node).
I want to do this exact same process, but instead of using the z-values, I want to use arbitrary values.
If I have a surface with n points, I will have an array with n values. These may represent temperature, salinity, velocity etc.
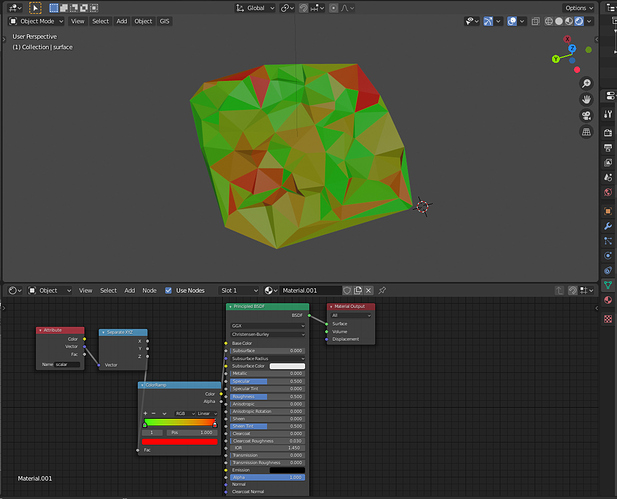
The node setup would look similar but have some kind of vector/array input into the map range node, removing the geometry + separate xyz nodes.
How could I go about doing this? Both GUI and python based solutions welcome! Would like to learn it first by GUI but will eventually be coded.
I’ve seen a similar question asked here but the solution seems to suggest that the process would have to be done for each value individually, as opposed to normalizing the array of values to 0…1 and using that? Similar Question: here
PS - if I’m way off and there’s a totally different and better way of doing this, please share!
