I’m currently creating an audio visualizer animation and i’d really like to have the waveform sitting in the background in the form of columns that represent the shape of the actual waveform of the song.
I know that it is possible to animate anything with a waveform through the f-curve, however that only allows for animating parameters in the dimension of time and I can’t find a way to use that feature for my needs, as i want the waveform to be static in space in the form of an object if that makes sense.
The only solution i could think of as of now would be to import the waveform as a picture and then manually scale the columns to match the height of the waveform, however that is way too much work for my procedural-workflow-loving brain 
If you have any idea on how to maybe have geometry nodes automatically scale the columns in response to the f-curve, to automatically have the columns match a generated picture of the outline of the waveform or have any other concept on how to solve this, i’d love to hear it 
Summary
This text will be hidden
If it is too much work to google how to do that, maybe pay for an addon?
Good luck!
1 Like
That add-on looks promising, however i wasn’t able to find an option to generate the height info of the waveform in a way that i could use it to control the height of the columns that i want to scale,
to me it looks more suited for animating in real time than for generating the static columns that i am looking for.
Do you know if that is possible using this add-on?
Bake the audio to various frequencies. Each of them drives one of the bars in a graphic equalizer. So you need to rebake 10 times for a 10 band equalizer. Put the origin of a cube at its base and use the baked data to drive Z scale. Keep the origin in the center if you want the bar to scale both up and down.
Lots of old tutorials on this - hopefully. Many 2.5 -2.8 tuts have been deleted because they are outdated. Stuff like this is unchanging - apart from the recent change of ‘Bake to f-curve’ now being ‘Sound to samples’.
Drivers…
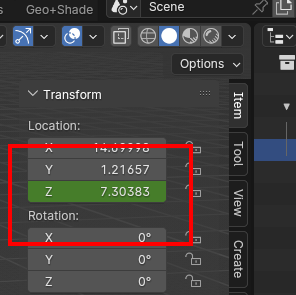
Once there is a baked value, like the green Z above - Right Click and Copy as New Value.
On the scale of the graph editor cube - Right Click - Paste Driver. It will turn Purple.
No doubt this can also be done with GeoNodes by bringing in the correct Attribute name if one exists.
Rinse and repeat…
If you dont want an animation then render out 1 frame.