Intel Arc A770 Blender 3.6 performance?

Now that 3.6 has Intel raytracing support ( https://builder.blender.org/download/daily/ ), I wonder how the performance has been improved. If anyone has A770 and tested Blender 3.6, please let me know about the performance.

I am trying to move from AMD to Intel, because I am tired of AMD’s driver bugs.

2 Likes

Curious to know as well.

1 Like

Embree on GPU is still experimental!
It has had some improvements already compared to when it showed up a few weeks ago, and it will likely keep improving so please keep that in mind.
The same should also be said for AMD, a lot of their performance improvement was flat out negative (hence the 7% average that was shown a while back) and that will likely be fixed as time goes on.
CUDA, and by extension Optix, have had a very long time to mature and (If I recall correctly?) got away with not supporting some things initially (like volumes, or AO/Bevel), the same can’t be said for HIP/oneAPI.

I have done some testing with the A770 LE 16GB (and a 3700x), with command line rendering. Here are the results with Embree on GPU off vs on:

barbershop_interior: 182.47s, 196.307s, 203.713s, 3509.37M -> 154.55s, 156.257s, 163.413s, 3230.63M
bmw27_gpu: 19.1767s, 20.4567s, 21.8967s, 1458.15M -> 15.6667s, 15.7467s, 17.1933s, 1447.06M
classroom: 42.8133s, 43.1333s, 44.13s, 2122.68M -> 34.0433s, 34.24s, 35.22s, 2116.7M
cosmos_laundromat: 99.34s, 131.537s, 154.113s, 8566.36M -> 74.63s, 87.45s, -1s, 6201.84M
flat-archiviz: 94.4233s, 96.2767s, 127.443s, 3905.09M -> 76.1167s, 76.8467s, 108.017s, 3874.1M
junk_shop: 6.29333s, 11.73s, 16.89s, 6116.52M -> 5.45667s, 6.82667s, 12.0633s, 5789.44M
monster_under_the_bed_sss_demo_by_metin_seven: 68.0667s, 68.7267s, 70.7933s, 2051.31M -> 57.3267s, 57.5s, 59.5733s, 2029.29M
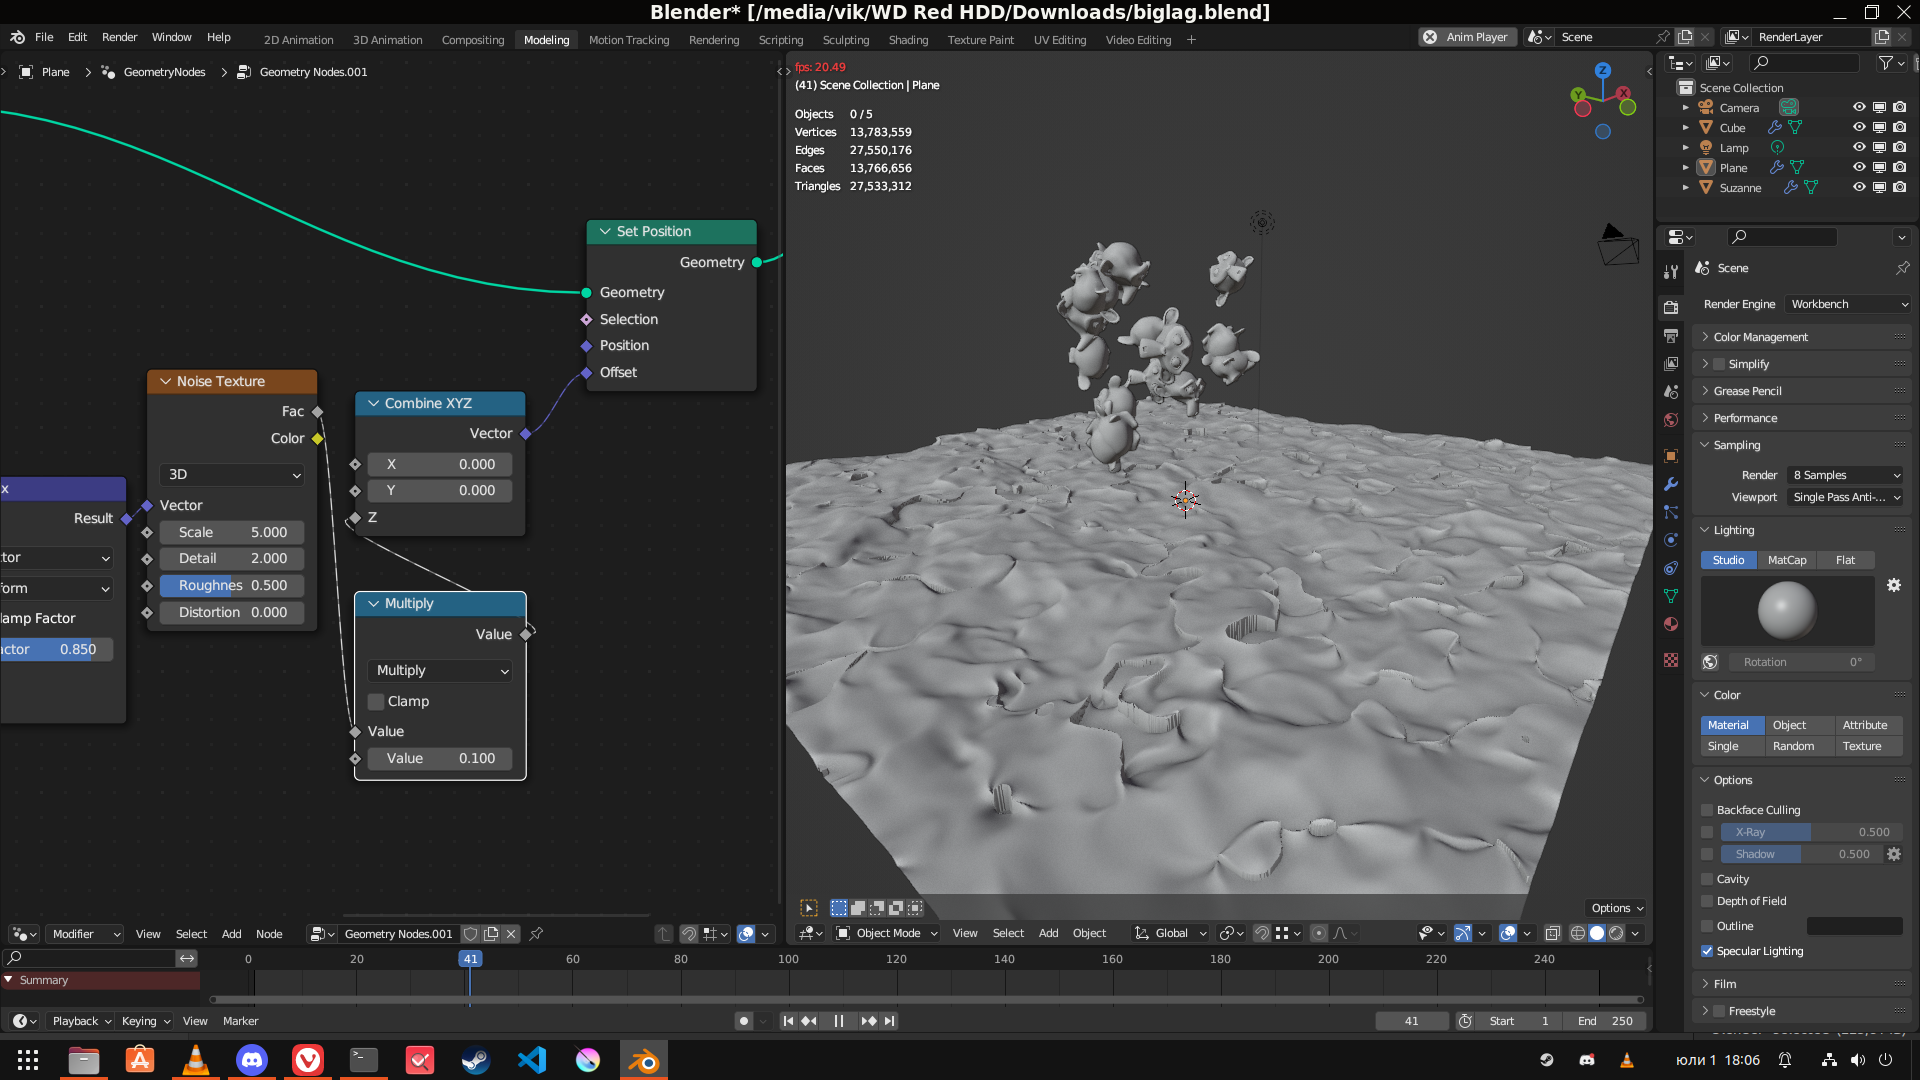
one_lotsa_hair: 10.4467s, 24.4333s, 42.6267s, 4193.68M -> 24.5333s, 27.51s, 45.68s, 2943.94M

Reading the numbers: Time from when “Sample 0/…” is shown to final sample, time from when first “Updating Geometry BVH” is shown to final sample, total time (incl. CPU/other-bound things like calculating modifiers, reading the blend file, etc.) and peak memory.

If you want me to test something more, I can.

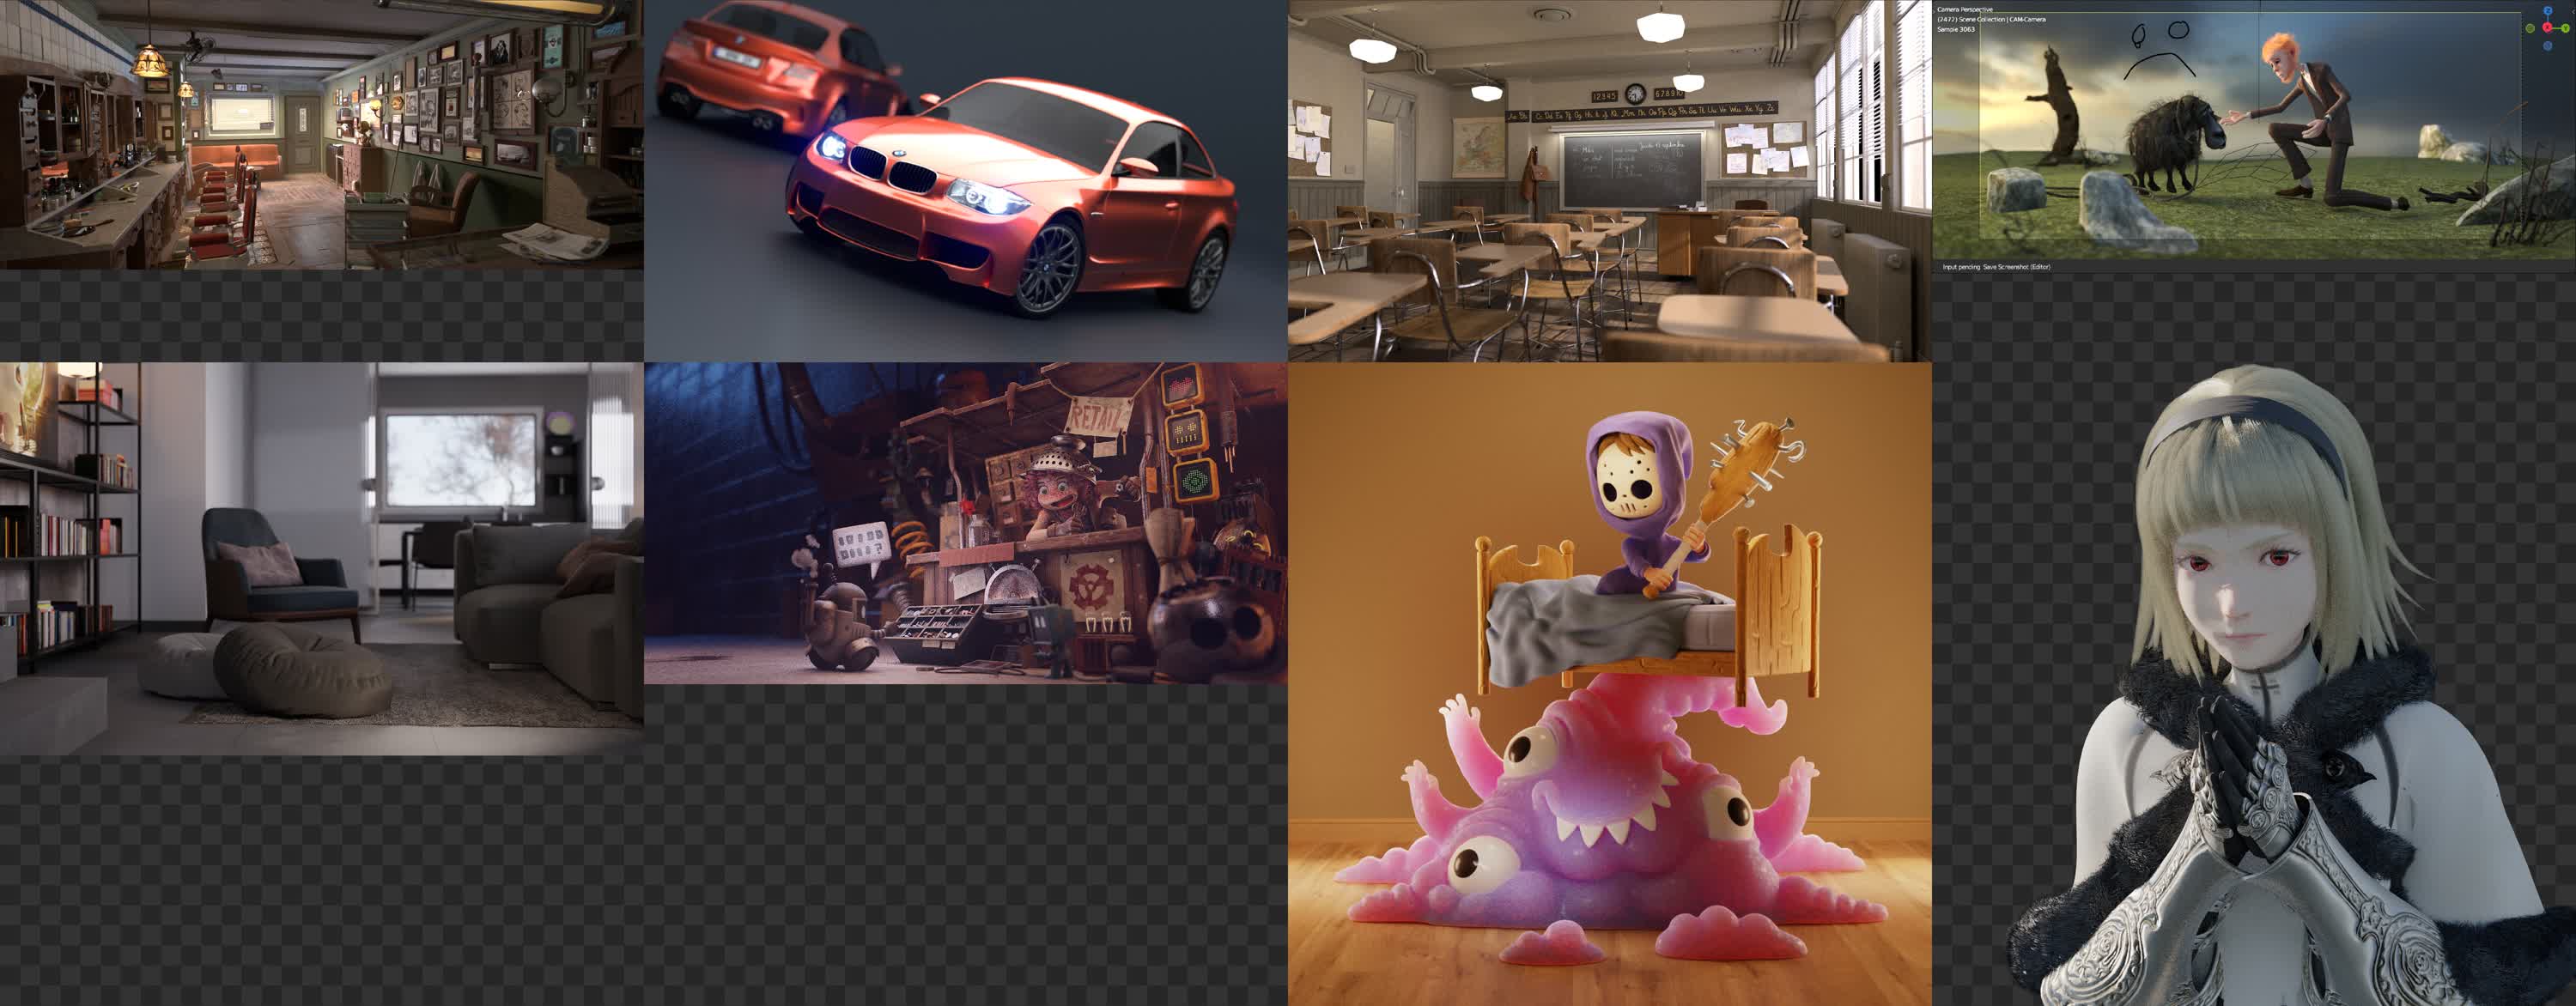
Here’s some render results, collated into a single picture so you may inspect them for artifacts (though I didn’t see any):

Pic


The above is a lower resolution picture for preview. I don’t know why the big one doesn’t work when I posted my reply, probably because it’s big, so here’s a direct link: https://i.imgur.com/kbxDOKa.jpg


Methodology / details / extras

Driver used was 4369, testing on Windows with the 5531d610f9a7 3.6 beta. The GPU is the A770 LE 16GB, CPU is the Ryzen 3700x, and there’s 48GB of non-XMP’d RAM @ 2400MHz. No overclocking on anything else either. Cycles’ render devices were set to the GPU, without CPU, as that lowers performance for any GPU anyways, not an Intel issue. Rendering was done from the command line with factory-startup, which starts faster due to not loading a ton of unnecessary addons. The files were rendered once, discarding this result, then averages of 3 renders are taken (memory is max, though, it shouldn’t vary).


Here’s the full results, including every single benchmark:
full_out.txt (7.7 KB)


Barcelona did not work in Cycles, with CPU, so not an Intel issue. All textures were white. Worked in Eevee though… Oh well. That’s why it’s not in the results. Also it complained about not having a water bump texture when packing (water still had bump). Man…


Cosmos laundromat caused a bunch of bone-related errors when loading (Intel unrelated). It rendered fine without Embree on GPU, but with it enabled Blender crashes after rendering finishes (Intel related). This is why there’s a viewport picture instead and a -1 total time. Also, the eyes are not a black artifact, just a wireframe at a low resolution.
Also also, rendering cosmos laundromat in Blender causes my PC to freeze for a bit midway through, getting a spike in 3D GPU utilization and compute dropping, then resuming as normal. No running out of RAM or VRAM, so this is likely a related bug.


Reading the full results, barbershop crashed similarly on its warmup render, but did fine otherwise… I don’t know if it’s the exact same case though, since I overwrite the log Blender gives on each render, and at a glance it doesn’t seem reproducible given the other renders worked fine.


Embree on GPU is still somewhat experimental. When it was introduced a few weeks ago, Junk Shop actually became 50% slower to render with Embree on GPU, and my nightmare hair test became 2x slower. As you can see, this has clearly changed already, and performance will most likely keep improving more and more.


Embree on GPU did not work on Linux a few days ago, but Intel JUST released a new update to their compute there / a Blender update may have fixed it.


Denoising, when present (Italian flat, junk shop) was turned off.


The bonus render (one_lotsa_hair :pray:) is a model I found online :^) and did a bunch of tweaks to. Hence, I’m not super comfortable sharing it. The hair was very painfully done using the old particle hair system. Hence, it looks slightly odd in some places. One day I’ll update to the new hair. The character is One, but is not a oneAPI mascot; rather, from a niche, not super good PS3 game, directed by the same guy who directed Automata. If you actually care about this though, please emulate it (not pirate it) instead of playing it on a PS3, you will have a much better time at 60FPS.
Included because I like benchmarking it, and because the hair’s rendering results are interesting.

3 Likes

So, when it is faster, the uplift is about 15 to 25 percent. Similar to the AMD results. Could you run these scenes so we could compare the boost in performance against Nvidias CUDA/Optix? That would be great.

Benchmarks

Reading the article, they do not mention denoising, and the dropdown for it on some of the files (scanlands, white lands) is empty. They say they rendered the files as-is, F12 and go. This means that Optix was used on Nvidia, and OpenImageDenoise on everything else. Optix runs on GPU and is substantially faster, but is also substantially worse in quality, especially compared to the updates OIDN has received. OIDN currently runs on CPU only and will get ported to GPU (every GPU, not Intel GPUs). For their rigor in their other testing decisions, this seems a bit weird. Either way, on my 3700x I usually get ~1.5s for a 1080p image.

I’m also not uninstalling the various driver things or turning off windows defender. Just kept blender, file explorer and vscode (to take notes) open.

So, testing their way (rather than command line and everything), the results I wrote down:

Secret deer:
off 68.63, 56.12, 56.14, 56.12, 56.52
bugged "on" 56.36, 56.11, 56.64, 56.13
on with no persistent data 46.93, 46.93, 46.86

White lands:
off 949.67, 92.34, 92.34, 92.57
on 1003.94, 85.73, 85.68, 85.97

Scanlands:
off 741.86, 173.18, 170.74, 170.58
on 680.97, 105.09, 105.26, 105.05

Big kernel compiles on scanlands and white lands. Almost no improvement for secret deer from Embree on GPU (I tested an extra time to make sure!), however it has gotten general improvements and I’m taking 11 seconds less than techgage anyways. Note that it has persistent data on.
Welp, this is why I don’t like benchmarks like this. It’s likely a bug that the persistent data prevented Embree on GPU from properly working when I toggled it on after rendering with it off, and I got the same times as before.
I didn’t restart Blender every single time for clean render results, and I doubt techgage did either. I disabled persistent data and re-tested with Embree on GPU on, I don’t think I’ll bother retesting off for now; there are clear improvements with it on.

Scanlands gets a massive improvement.

All in all, experimental, it’ll be interesting to see the state it’s in once 3.6 gets out of beta as well and they’ve done more polishing.

3 Likes

Fair observations on their testing methodology. Definitely there is no need to recreate their exact conditions, just running the same scenes gives more than enough information to establish the general idea. The tech seems to be working quite well, considering this is intel’s first generation product.

I’m glad there’s a thread on this.

For me, 3.6 shows the potential (viewport with just 2 samples and denoise is what I use a lot of the time) Per the 3.6 release notes, future improvements might be expected via A770 driver updates.

Are you on Windows or Linux? I finally have bought an A770, and tried to use the 3.6 beta version but the quality seems like an alpha version. First, the window size is weird. The window border is maximised, but the actual client area is a quarter. Also, when starting Blender, the window is initially in the middle of two monitors (I’m using multi monitors). And, when I tried to render (or switch to the render view), Blender crashes with:

free(): invalid pointer
Aborted (core dumped)

It is beta, but I can’t even test Blender 3.6.

I have used the A770 both on Windows and Linux (specifically Ubuntu, I’m not touching any other distro after seeing AMD’s drivers targeting it mainly, and now Intel as well). The results I’ve posted here are on Windows.

On Linux, at the time of testing Embree on GPU didn’t work, specifically it’s rendering only the world shader, no geometry whatsoever, and last I checked (<1 week ago) it still doesn’t, but outside of that regular GPU rendering should work. The A770 on Linux is known as 0x56a0 on Opendata (according to the specification, that’s its device ID) in case you’re looking there, and the top result (1676) is mine. I have not overclocked the GPU, watercooled the GPU, or anything of the sort. I have no idea why the rest of the results are that low, my result matches what I (and others) got on Windows. I presume it could be people who had not properly installed the drivers or something, but that might be completely wrong. It also could just be worse drivers from 6 months ago?

the window border is maximized, but the actual client area is a quarter

I don’t know what you mean, though that could be a multi-monitor issue. I’m using just a single 1080p60 monitor. You can report the issue I guess: https://github.com/IGCIT/Intel-GPU-Community-Issue-Tracker-IGCIT

I haven’t had any crashes when just starting to render. I have had crashes now in one file (besides cosmos laundromat as noted in my test) when a render finishes with Embree on GPU on, but viewport works fine in both. I have no idea what to tell you other than try 4.0, try without Embree on GPU, or use the beta drivers rather than the WHQL ones (though this shouldn’t make a difference).

Furthermore, you probably should DDU if you’re switching from some other GPU (and Intel staff on that repo have directly told me to DDU for driver issues just in case, so, take that as official confirmation).

I have been told from another Intel person that Embree on GPU hinges a lot on Intel’s own drivers, namely that improvements to it will come from driver updates, though I dunno if I’m misinterpreting that.

I’m using Arch, which has a newer kernel. Isn’t Arc supposed to work better with newer kernels?

And isn’t DDU or something for Windows? I had asked online before replacing the card what I should do, and people said that just uninstalling AMD packages and installing Intel packages is enough.

The quarter content-area and other UI anomalies maybe due to dual monitors (and I also use fractional scaling), but the problem does not exist with the 3.5 version, so it must be a new problem with 3.6. And it seems that 3.6’s release is just a few weeks from now. That’s why it is surprising. By this time, shouldn’t the UI be stable?

Isn’t Arc supposed to work better with newer kernels?

Dunno. I’m not interested in trying those out. Up until a month or two ago, they were recommending an OEM kernel for Ubuntu. Right now the one they say to use is 5.19.0-35 https://dgpu-docs.intel.com/installation-guides/ubuntu/ubuntu-jammy-arc.html. I’ve heard people say 6.3(?) “works”, but I can’t help you with that. However I have a feeling that this isn’t a new or old kernel issue.

Windows

I assumed you were talking about Windows, hence DDU. The github repo is for Windows issues, and they want you reporting Linux issues to Mesa instead IIRC (you can check the Windows repo anyways to see where to go for Linux).

As I said, I haven’t had any luck even getting Embree on GPU to work on Ubuntu either way (with that recommended kernel).

Hi everyone. @Viktor_smg it looks like you have quite experience with Arc.
I’m seriously considering jumping from Radeon to Arc, and maybe you can answer one question I have. How Arc handles really heavy scenes, like 30mil poly and more? I mean in both Workbench and Cycles. EEVEE is not that important to me at this moment.

Do you have any particular scene or method to test with? Testing for viewport performance feels like quite a shot in the dark. Either way… As a very broad statement, I can tell you that it feels like OpenGL performance (in the 4 OpenGL things I tried - the TY the Tasmanian Tiger trilogy of games, and Blender) is very bad, on WIndows. The games feel like they perform a bit better on Linux, but Blender is pretty much equally slow.

Vulkan and DX12 perform better for games. Testing Workbench-next didn’t make a significant difference, but then again it is still experimental…

Here’s a scene I cooked up real quick:
biglag.blend (169.6 KB)
I also decided to test scanlands.

I measured by just playing the animation, on a 1080p monitor. While I tested predominantly with 4.0 e9e12015ea98, testing occasionally with older Blenders like 3.6, 3.5 or 3.3 didn’t yield a noticeable difference. Both files have no animation so it’s just rerendering the same thing and can give a decent FPS count (IIRC, due to Blender stopping to render if nothing changes, and other factors, conventional FPS counting software didn’t like it much). With the floor selected (how the file comes at the start), I get ~17 FPS on Windows with 4514, ~16.5 on Linux with Mesa with some version I forgot to write down, but should be latest. With it deselected, ~21 and ~20.5.
Fullscreening the viewport on windows vs making it extremely tiny makes a massive 1 FPS difference.
Someone else (or you) can chip in with FPS numbers from other GPUs (/CPUs?).

With scanlands as-is, I get 2 FPS on Windows. Shrinking the viewport got it to 4. Couldn’t bother to test more.
Some pics:

While you’re not asking for Eevee, it’s the only thing I have some reference to for other GPUs, and you will probably still be taking a peek in material preview every once in a while. I used to have an RX 480. In a certain scene, I used to get ~10.5 FPS on Windows. AMD finally released their driver update that fixed OpenGL performance on Windows, and that went to ~45 on average (big fluctuations from 20 to 60). Loading that scene back up now, with an A770, I get ~20 consistently.

RX480 pre-OGL improvement

RX480 post-OGL improvement

A770 now, 4514

BOTH GPUs render the world shader incorrectly by the way. I used some exponent, and I guess that kinda kills the precision. The A770 version of the file I used may be after I did some tweaks to at least have a more reasonable looking background in Eevee. Undoing it does not affect performance in a noticeable way.

Interesting to note that said AMD driver also didn’t affect my render time for that scene (36s). The A770 renders in 27s. 16 samples, and some higher quality geometry. Then again, Eevee has some other issues with rendering, like the fact that if you have VRAM to spare, rendering with multiple Blender instances with it can literally be a 2x or more boost.

I believe Arc currently has a decent bit of CPU overhead with its drivers in general, but I haven’t seen any serious testing about that. I can’t tell you if a 7800X3D would make a massive difference or not. I don’t have CPUs and motherboards lying around to swap out and test. CPU usage does increase a decent bit when I play the animation - or when I pan around with it not playing. I have a 3700x, so if you have a CPU with similar STP these results will likely be very close.

1 Like

So I opened the ‘biglag’ file and pressed play on a 1440p monitor. The FPS display sits on 100. If I then start to pan/zoom/rotate the viewport around, it still sits on 100 FPS. If I have the floor or Suzanne selected or not selected, it still sits on 100 FPS.

Not sure what the bottle neck is, as the GPU is only going at around 45% and the CPU is topping out on 1 core at 25%.

This is all using Blender 3.6 with a Ryzen 5900X and a RTX 3080 Ti. So yeah, seems Intel still have a bit of work to do.

2 Likes

Thanks for detailed reply and the data! Appreciate it.

Unfortunately vast majority of my projects right now is CPU only as they require 128/256GB of RAM to open and render. I can prepare smaller scene with smaller amount of geometry and simpler materials to test.

But what you showed on the screen shot looks good enough at least at the first glance.
I’m not interested as much in playback, but this might change in the future with Simulation Nodes.
I’m mainly interested with viewport performance with heavy geometry when navigating and modeling in workbench (object and edit mode).

Vast majority of shaders that I use are too heavy for EEVEE. With big geometry and heavy shaders EEVEE is slower than Cycles when it comes to ‘real-time’ preview. I don’t use material preview practically at all.
That said the numbers you are posting look very interesting. Looks like Intel have some work do to in that department.

You mean Cycles too or only Workbench/EEVEE?

I’m not interested as much in playback

This is the best and easiest way I know of to get a good FPS indicator in Blender. At a glance, panning around has the same FPS as playing back the nonexistent animation, but I can’t know since I don’t have an indicator then, hence, that. And as thetony confirms, this animation with nothing animated playing likely has almost no real impact when nothing in the scene is changing, and is mostly just GPU load, so the FPS numbers are representative enough of panning around the viewport.

With things like simulation nodes, the load is on the CPU, the only exception is having a subdivision surface modifier at the bottom of the modifier stack, which can happen on the GPU.

You mean Cycles too or only Workbench/EEVEE?

Workbench, Eevee and other rasterizers, but not Cycles.

1 Like

Thanks for the info. I am mostly worried about freezes and crashes with big geometry or high complexity materials. From what you say it looks acceptable if we consider that this is the first dGPU Intel has released as a consumer product.

Cycles crashes with the new raytracing decently often, the crashes are known and should be fixed pretty soon. That’s about it. I’ve had other crashes or freezes but I can blame them on Blender (as they don’t happen with older versions) or shader compilation.

Time has passed, and I decided to retest with the current driver and 4.0.
Sadly I do not see any notable improvement over the old results, so I will not be posting them.
Cosmos laundromat now finishes rendering without crashing, for a total time of 107.17s in the three tests I did (vs 160.713s). Stability has been improving.

Just FYI new compute runtime is about to be released: https://www.phoronix.com/news/Intel-CR-23.26.26690.22

1 Like