Ok I’ve overcome a BIG road block.
Since the beginning, I’ve wanted my spectrogram to display volume in dB somewhat reliably.
In order to do that I had to understand the relationship between :
- the volume of the sound being played (in dB)
- the luminance of the spectrogram image (which is used for displacement)
My idea was to retrieve the peak volume of the sound, store it in the geo node, and use it to properly calibrate the displacement.
Step 1 : Volume
Getting the max volume was pretty easy. I’ve used FFmpeg’s volumedetect function, which outputs details about the sound’s volume, including a “max_volume” value. I had to parse and format the outputed text, but I was able to detect and store the value in Blender.
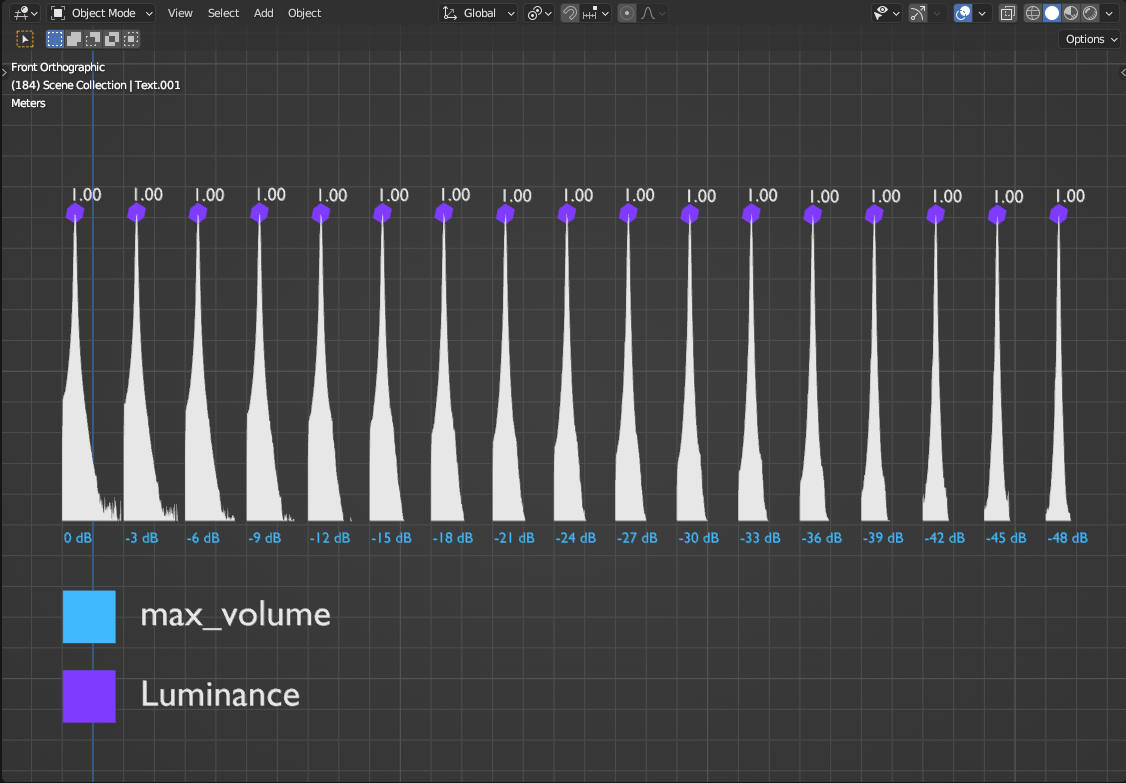
In order to test this, I’ve generated multiple variations of the same audio file, each normalized to a slightly lower volume.
In total, I’ve made files ranging from 0 dB to -48 dB, which I renamed accordingly. Then it was just a matter of running volumedetect on each file, and making sure the outputed max_volume was the same as the name of the file.
The results I got were very consistent, within a +/- 0.5 dB error margin.
Step 2 : Luminance
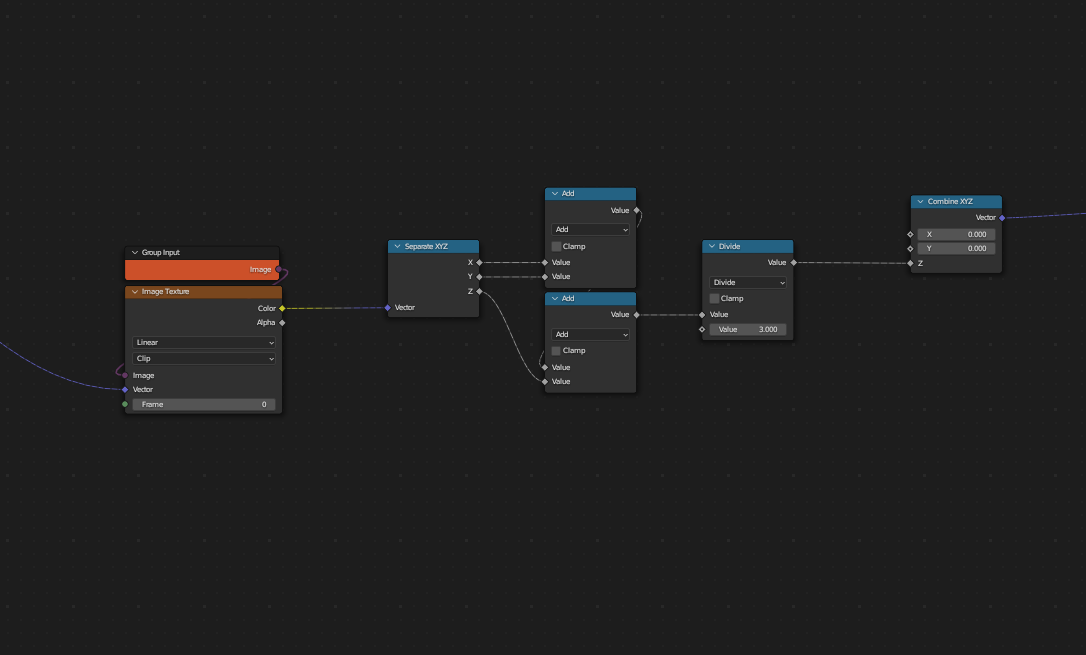
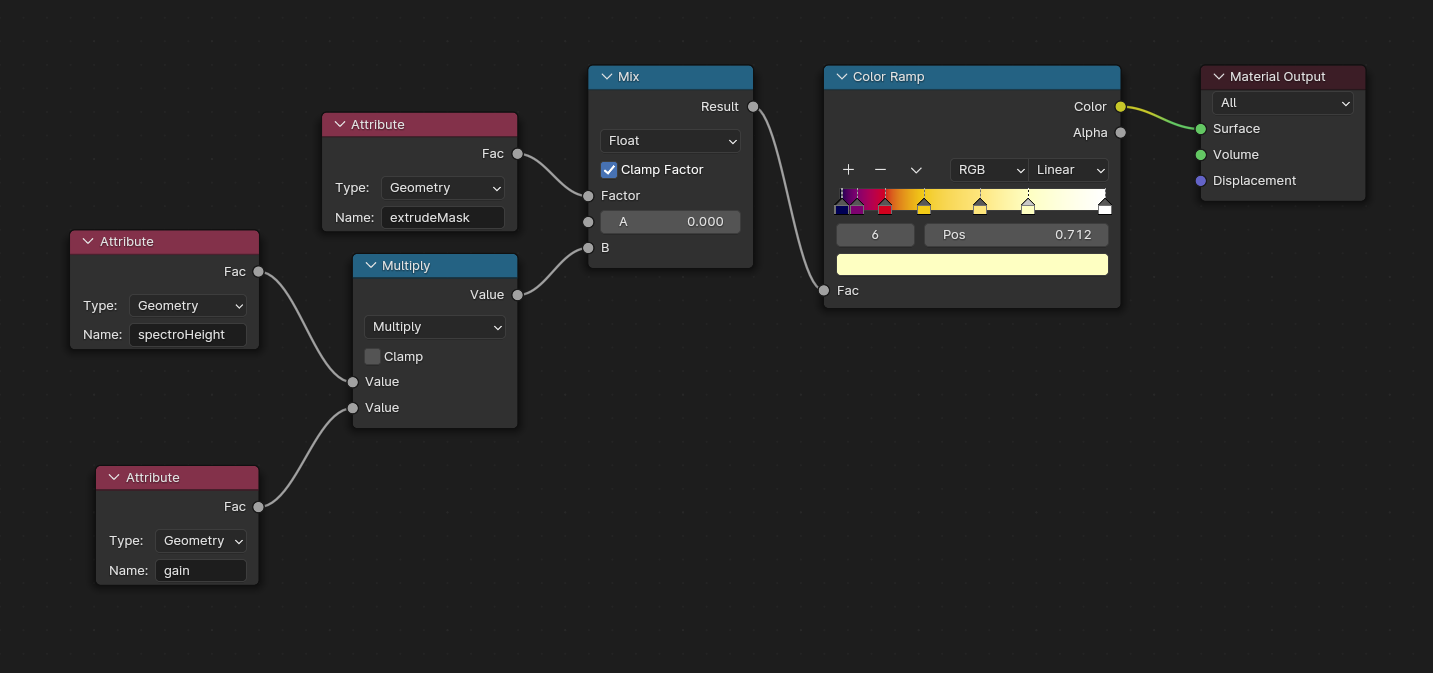
Before we go any further, I’ll explain the way I’m doing the displacement in Blender.
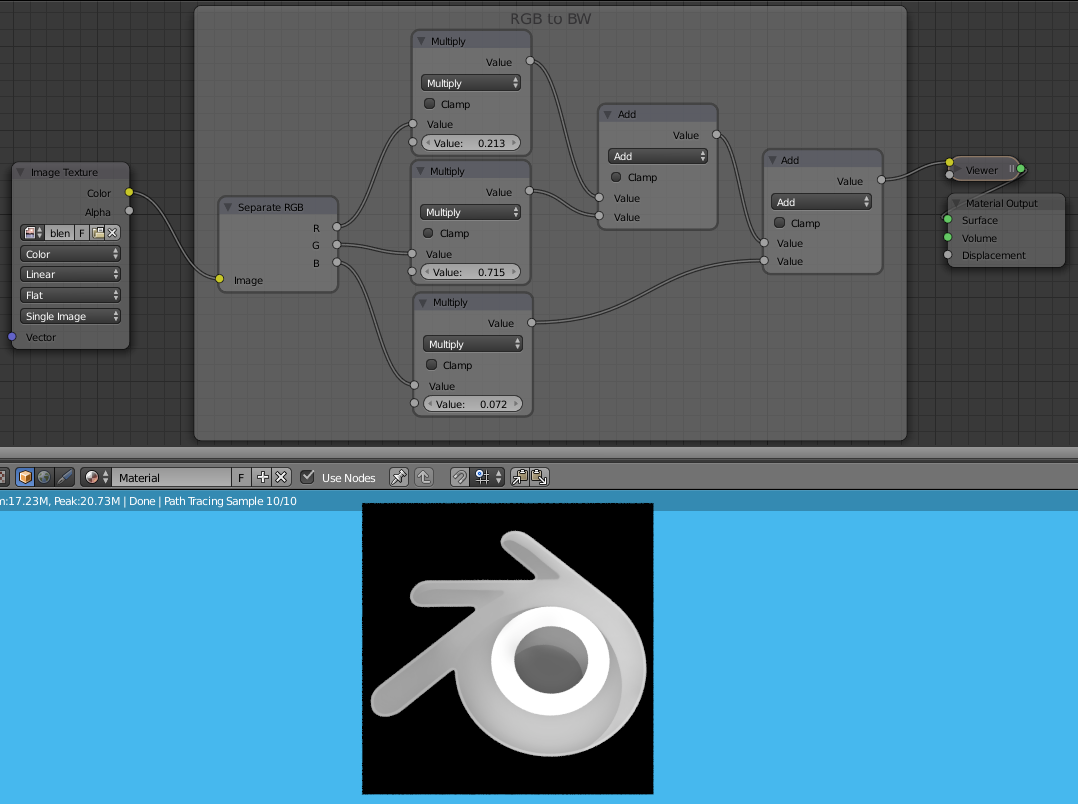
In the case of my spectrogram, I’m only interested in the luminance of the image to apply a vertical displacement. In other words, I need to convert the RGB output of my image into a float value containing the luminance.
|
For now, let's simply add the R, G and B channels together, and divide the result by 3.
There is many ways to calculate the luminance of an image based on
RGB values, we’ll keep it simple for now.
|
|
I now had to test wether the outputed luminance was consistent with the max_volume I obtained earlier.
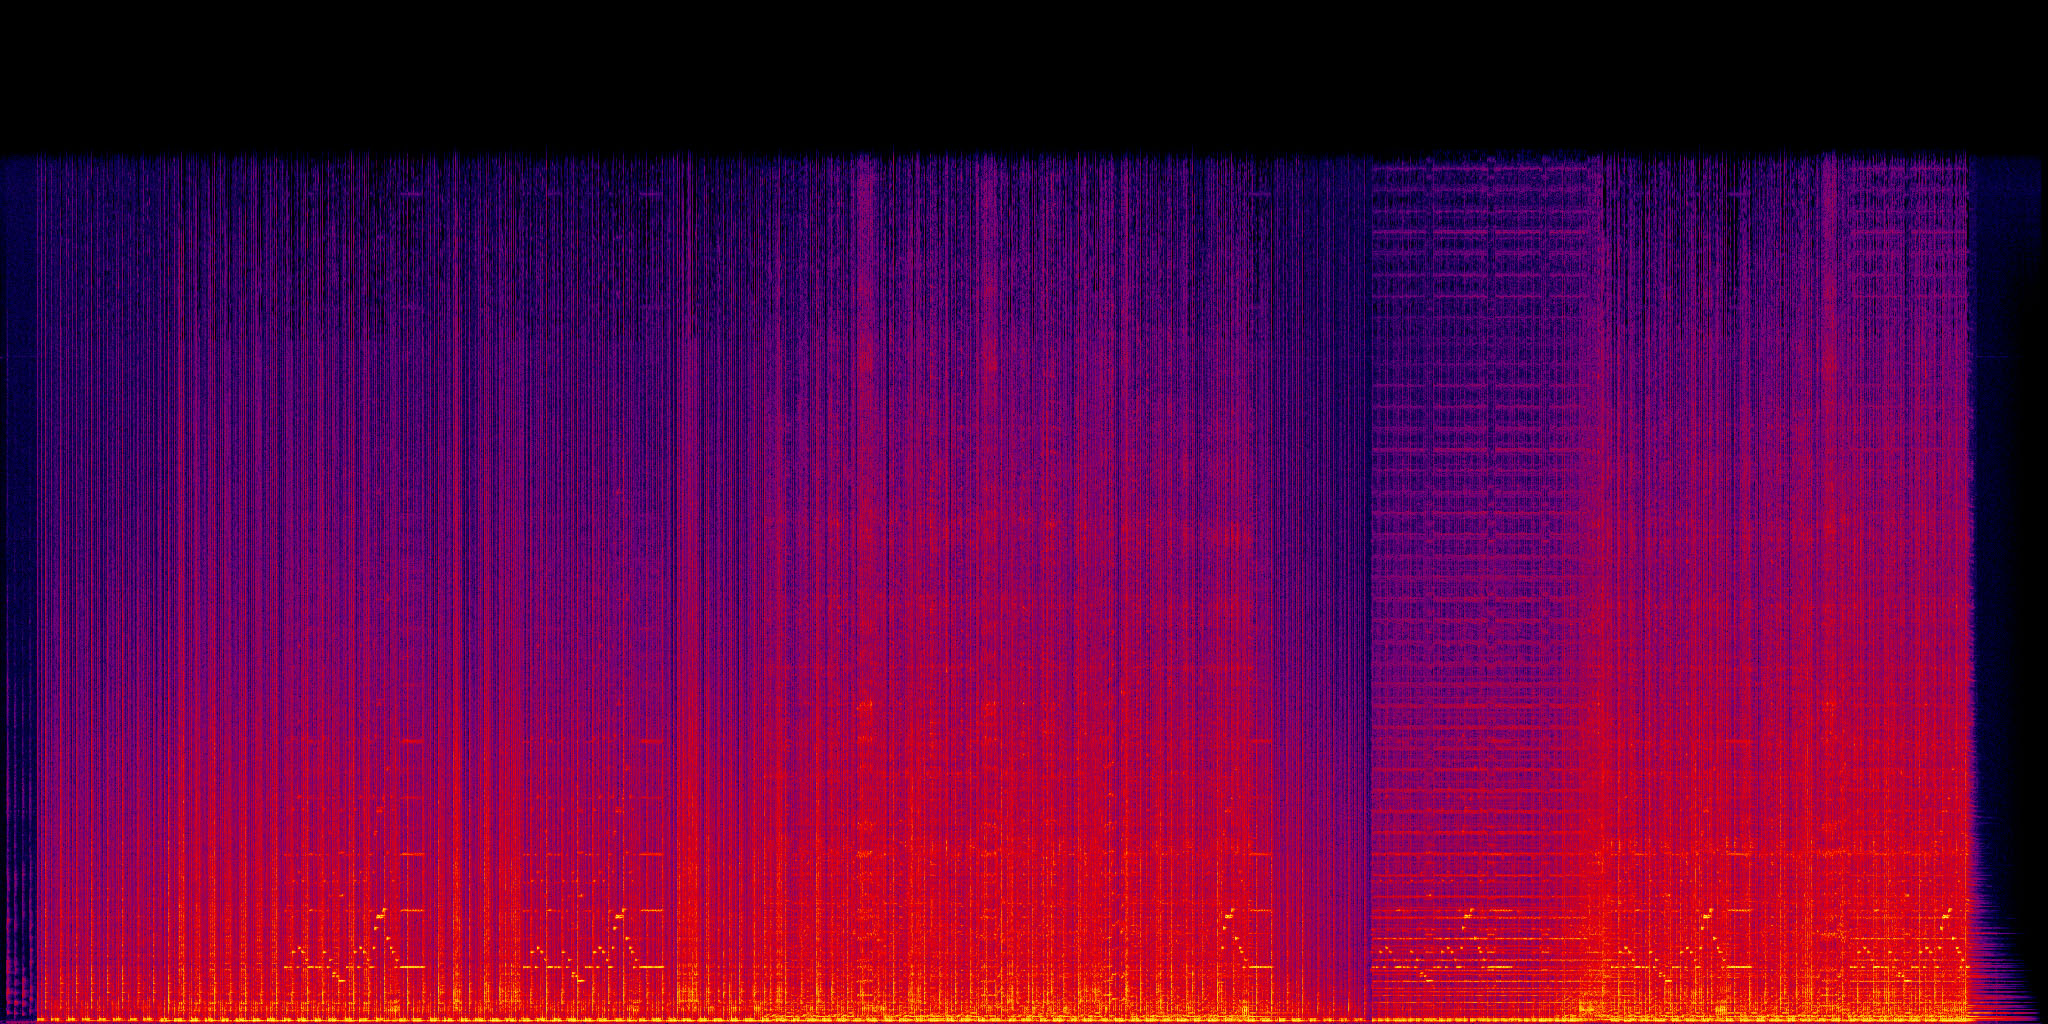
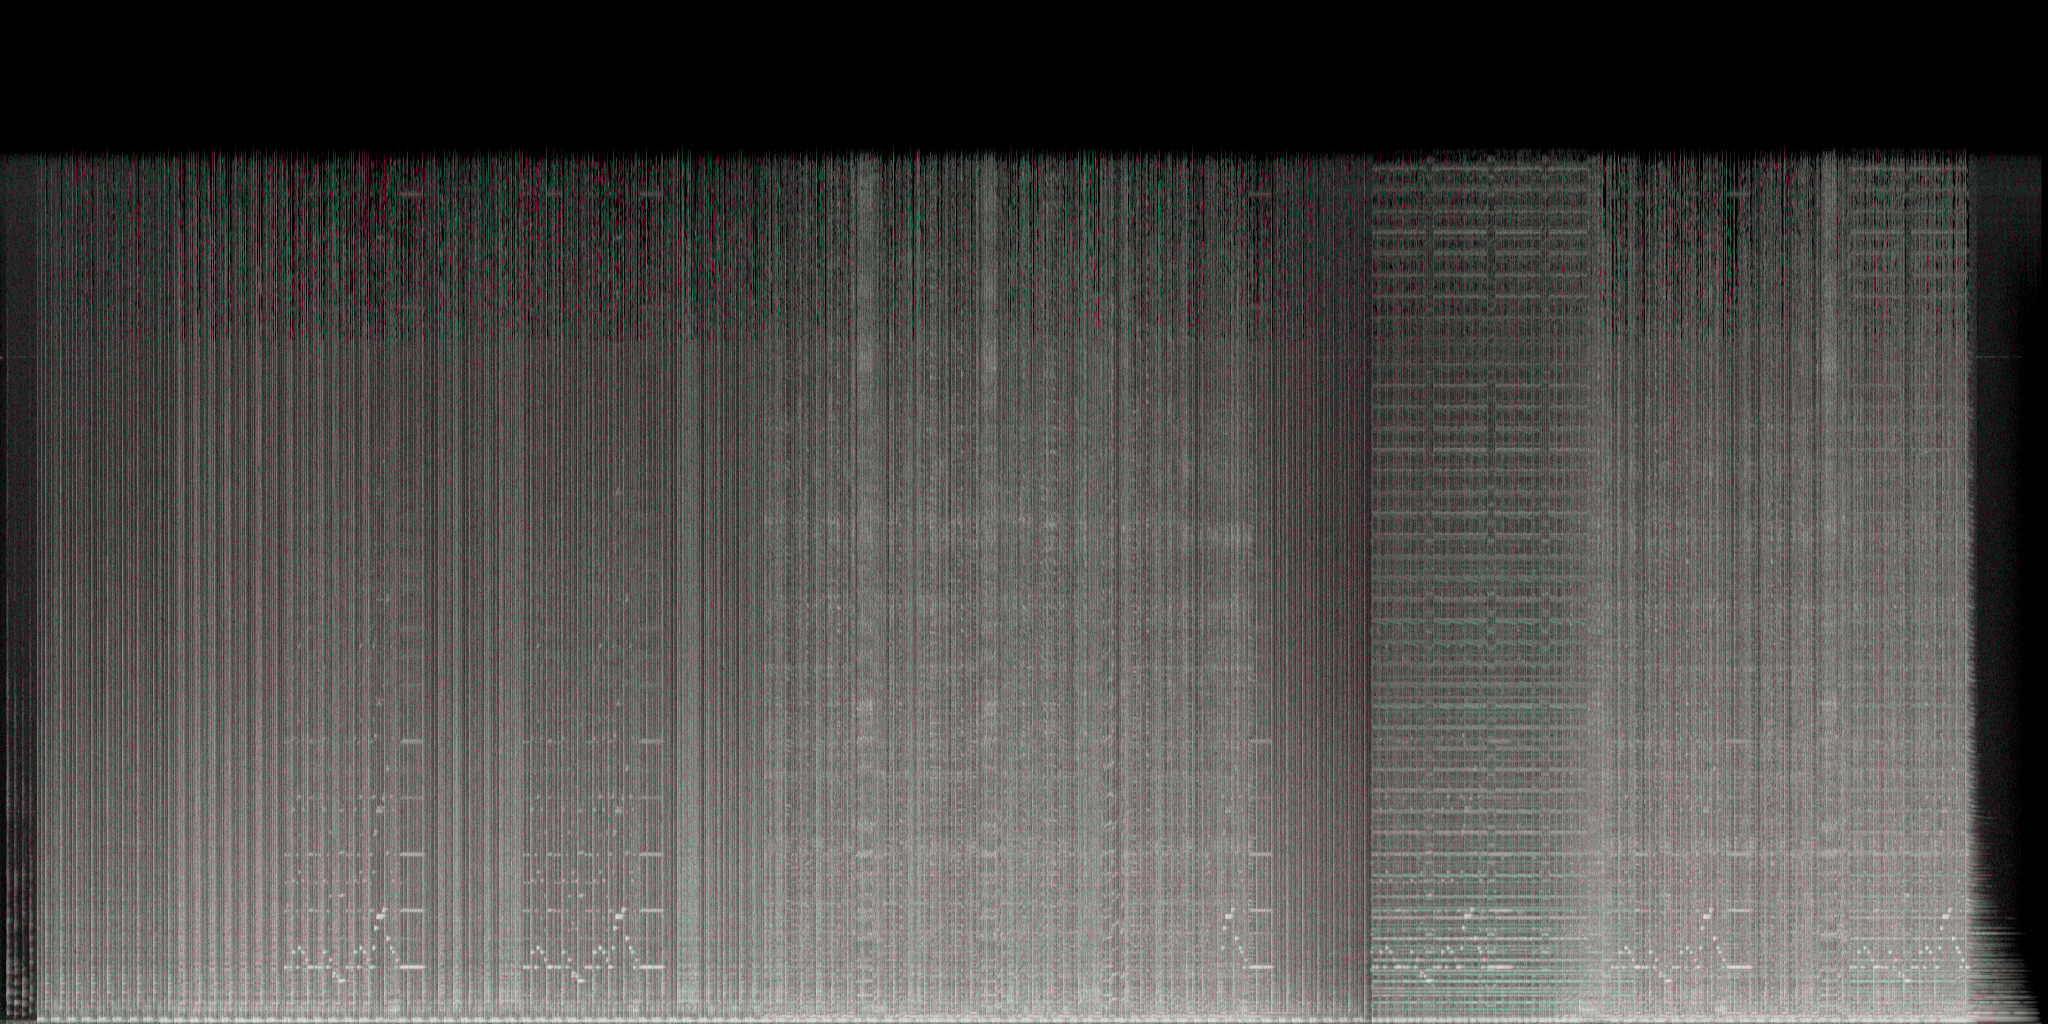
As explained above, I’m using FFmpeg’s showspectrumpic function to generate the spectrogram image.
Using my previously created sounds, I’ve generated spectrograms going from 0 dB to -48 dB. My idea was to compare the maximum luminance of the image (aka, the highest point of displacement) with the max_volume value.
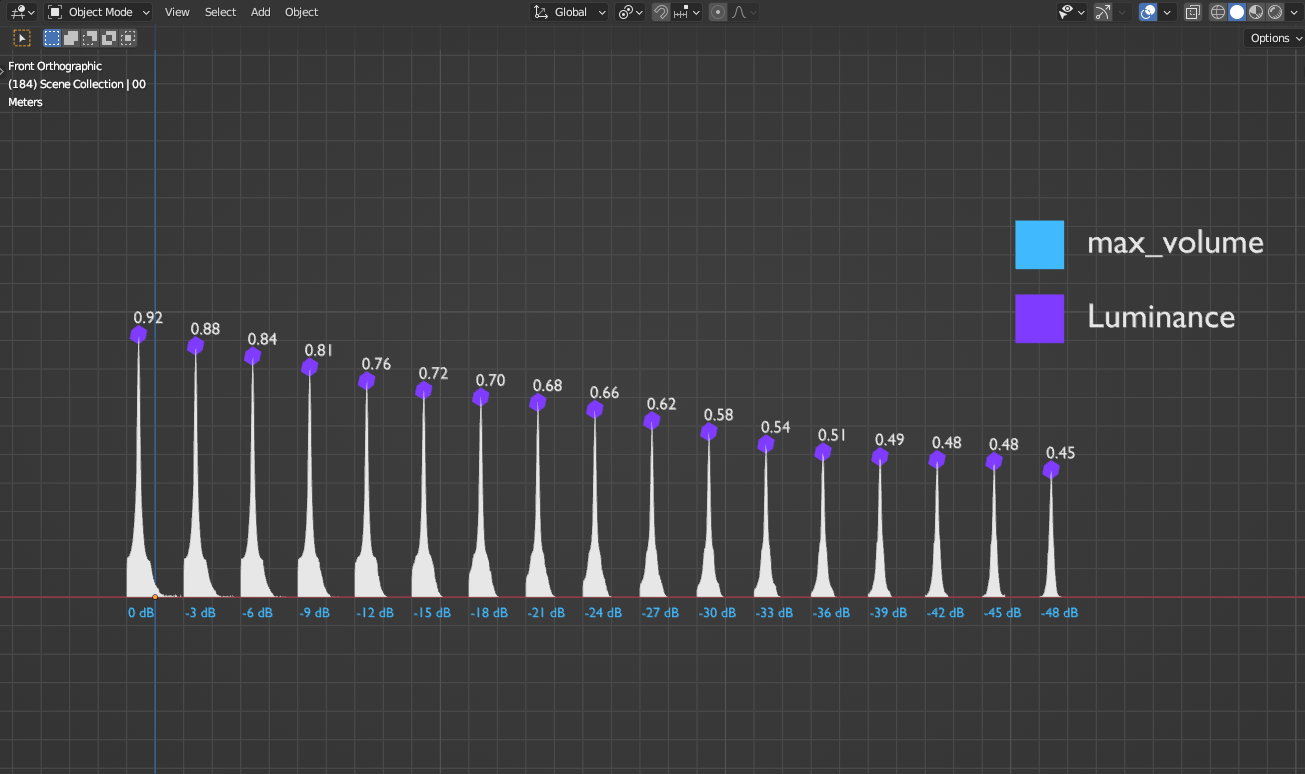
In order to test this I’ve created multiple spectrograms in the same scene, each using a different audio file, and compared the max_volume with the luminance :
As you can see, the luminance is ALL OVER THE PLACE. I was expecting a straight line, where the max_volume is somewhat proportionnal to the luminance, kinda like this :
| max_volume |
max luminance |
| 0 dB |
1.0 |
| -3 dB |
0.95 |
| -6 dB |
0.9 |
| … |
… |
| -45 dB |
0.55 |
| -48 dB |
0.5 |
And so began my wonderful quest on the path of luminance…
Step 2.a : Color Mode
First problem, when generating the spectrogram, FFmpeg applies a “color mode” to each pixel.
From what I understand it takes 2 steps to get a pixel color :
- it first calculates its luminance based on the sound volume
- it then looks up a color table set by the user, which determines what color the pixel should have
(you can see the color tables on the showspectrumpic github page)
In other words, FFmpeg applies a gradient on the pixel based on its luminance, which messes up the propotionnality with the max_volume.
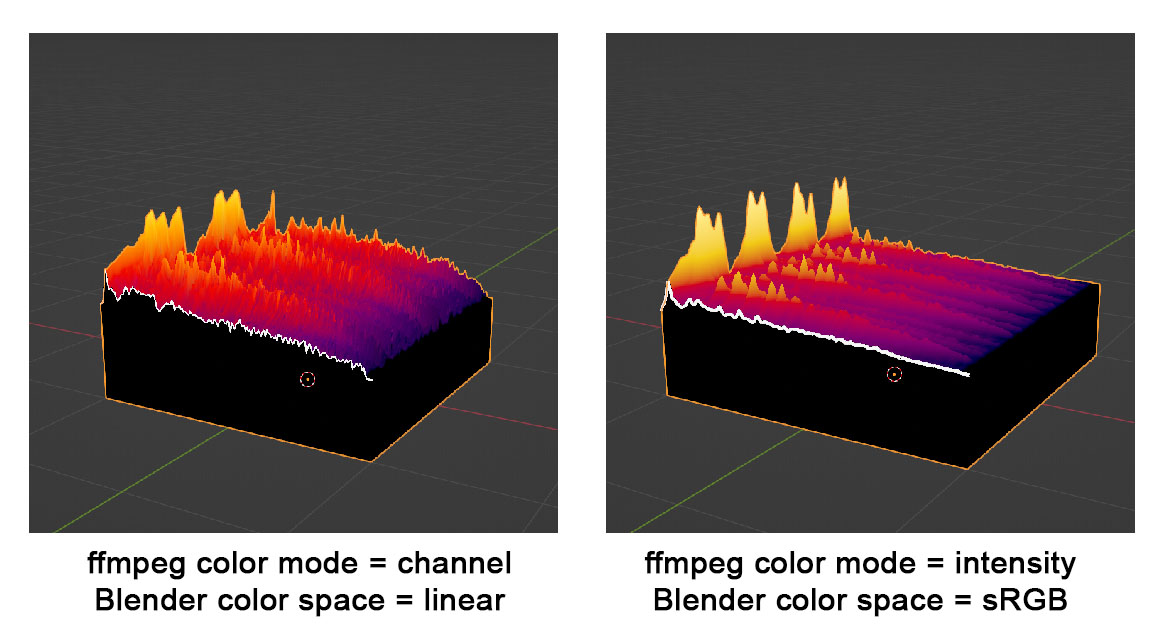
From here I used 2 different color modes to try and get consistent results.
“intensity”
|
This is the default color mode.
While looking quite cool, I’ve had a hard time extracting consistent brightness levels from it.
Sadly, this makes it unreliable when combined with the max_volume value.
|
|
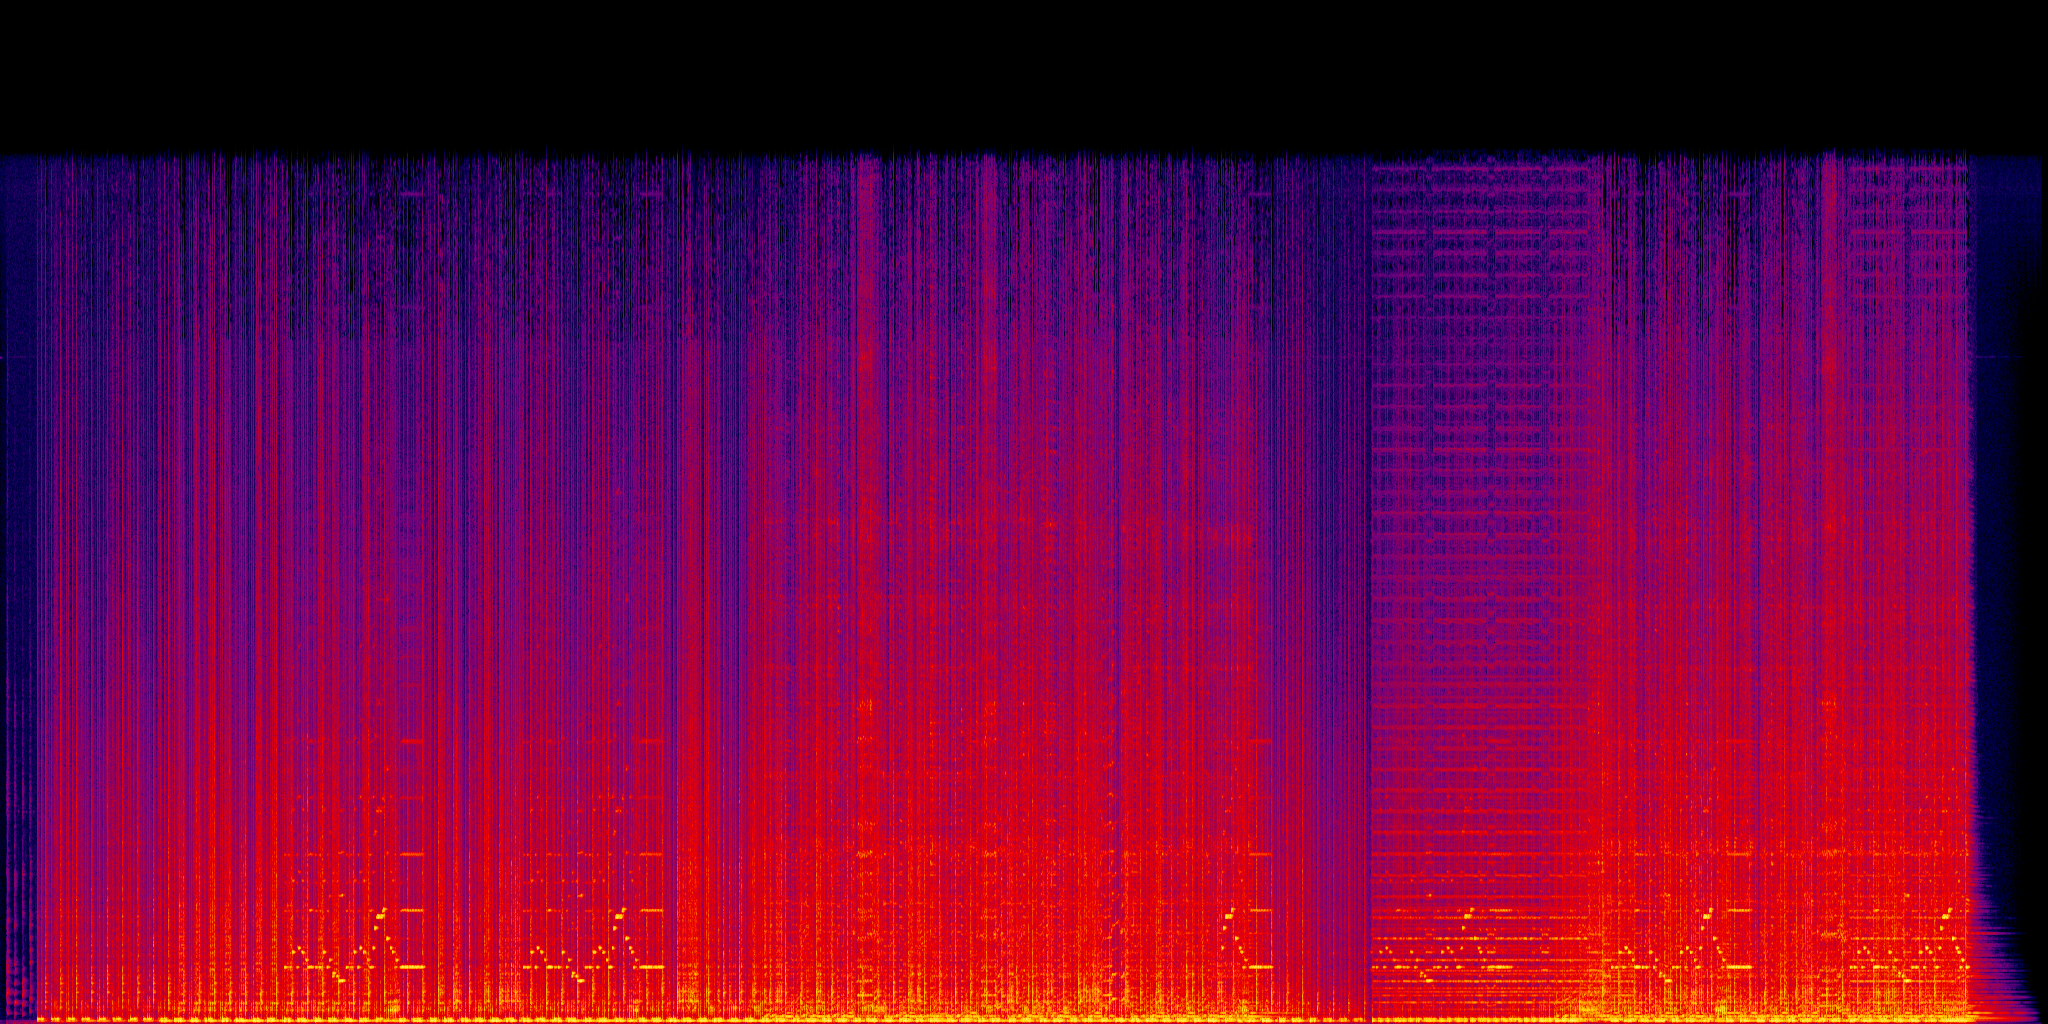
“channel”
|
I think this mode outputs the raw luminance of the pixels, without applying any color mode to it.
It looks a bit dull, but should be perfect for what I need to do.
|
|
I ended up using the “channel” color mode, since it’s closest to what I need to achieve.
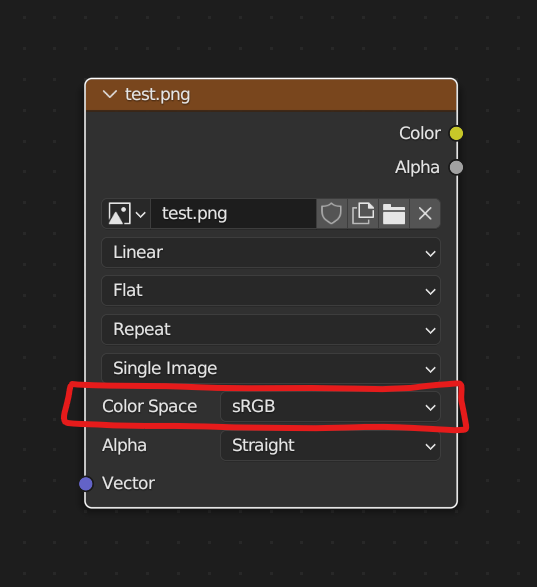
Step 2.b : Blender’s color space
Another culprit in my quest for luminance.
|
By default, Blender uses the "sRGB" color space when an image is imported.
While it looks fine on most images, the problem is it alters the pixels values, hence messing up the luminance.
|
|
To fix this, I’ve made a script to change the color space off all the images in the scene :
import bpy

for i in bpy.data.images:
    i.colorspace_settings.name = 'Linear'
The “Linear” color space outputs the pixels as is. From what I’ve tested, “Raw” and “Non-Color” work just as well.
Step 2.c : success
With all that done, I was able to get perfectly consistent results between the max_volume and the luminance, as shown here :
With a bit of fiddling in the geo nodes, I’m now able to normalize the displacement to 1.0, whatever the sound volume !!!
Step 3 : cool colors
Now that I’ve obtained consistent results with the “channel” mode, I’d like to get the same with the “intensity” mode. In order to do this I’d have to find how to extract proper brightness value.
For now the formula used above doesn’t work :
(R + G + B) / 3
I tried a formula to convert RGB to YUV, to get the Y component (which corresponds to brightness). The formula looks like this :
R*0.299 + G*0.587 + B*0.114
It doesn’t work either, so I think I’ll have to dig deeper in FFmpeg’s github to understand how the pixels colors are encoded, and try to come up with another formula.
Either way this is only for style points, so for now I’ll focus on developping the addon.
Thank you for reading !
edit : I’ve wrote this way too early in the morning, so forgive me if there’s any mistakes..