I’m curious if anyone has ever come across this before. I’ve been using Blender for about 14 years and this is a first for me.
So I had been working on a file for a while creating a whole bunch of assets. Some with particle systems and some with complicated shaders etc. I noticed that the playback lagged even when I had everything hidden. So I tried saving as a new file and deleting everything including the orphan data to test it. It still lagged on the first few frames. Opening a new default file plays back just fine. Is there some other data hidden somewhere that could still be creating that lag?
It’s not an issue that I actually need solving, I will just import what I need in a new file and it should be fine, but I am just curious, thanks!
First, need to define the difference between ‘hidden’ and ‘disabled’.
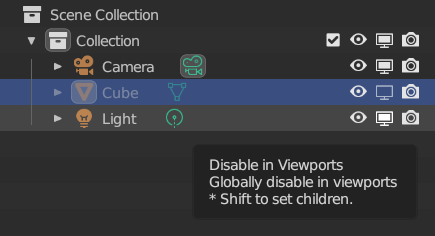
If you just click the little eye in the outliner, you have hidden the object from viewport display, but not disabled it. In other words, any modifiers, etc are still all being processed in the background. In other words, the CPU is still working hard.
If you disable it (need to show that option in the outliner using the filter drop-down at the top, the little funnel icon).
Then that will in effect hide the object, but also ‘turn it off’, telling Blender to totally ignore it as if it didn’t exist.
Thanks for the reply and welcome (I’m not sure why I never came on here before lol)
So having the objects hidden, disabled in the viewport and render or deleting the objects (with all their data) altogether doesn’t make any difference.
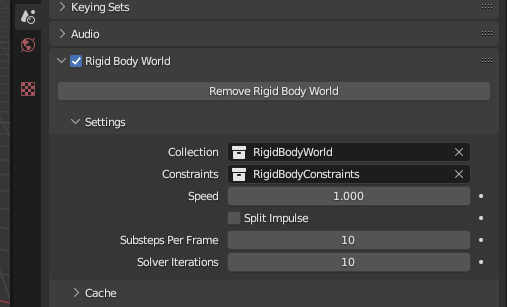
And the only thing I had left were the unused brushes in the orphan data.
The file is more empty then a default file (which works perfectly fine).
I also tried saving it on the C drive, but that made no difference.
It really isn’t an issue, I just thought it was interesting and am just curious if anyone else has ever experienced this.
Well, good to know you found what it was, I figured there had to be something active or turned on somewhere.
A possible good future check is to have task manager or some other monitoring app running and press play. If you see at least one core starting to go flat out, then you know that something is there causing Blender to process data. Since if you do it on a new default scene, playing back at 24fps, you maybe lucky to get a single core to hit 10% usage, with all other cores at 0.