This script adds in a visual profiler to the top left corner of the screen:
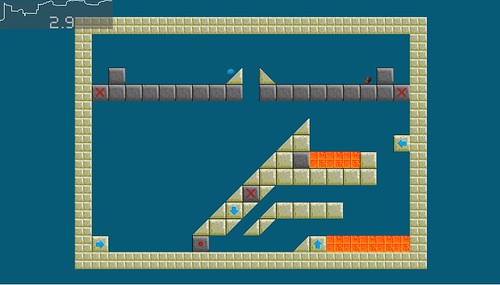
(the timer in the top left isn’t part of the script, thats part of the game)
To use, simply add a python controller to any object, set the controller to module and enter in ‘profiler.main’. Connect to an always sensor with true level pulse mode.
"""
profiler.py - a framerate graph
andrew-101, May 2011, Blender 2.56+

Thanks to moguri for the bgui, and the code from that which is used here.

Usage:
    Logic bricks:
        Create a python controller, set to module mode, type in
            profiler.main
        connect to an always (true level pulse mode)

    Python:
        Create a Profiler object and call it's main function every frame.
"""

import bge
from bgl import *

class Profiler:
    def __init__(self, frames=150, ratio=0.1, max=60):
            self.length = frames
            self.ratio = ratio
            self.max = max

            self.frames = []

            self.cur_frame = 0
            self.last_push = 0

            self.visible = True

    def render(self):
        view_buf = Buffer(GL_INT, 4)
        glGetIntegerv(GL_VIEWPORT, view_buf)
        view = view_buf.to_list()

        glPushAttrib(GL_ALL_ATTRIB_BITS)
        glDisable(GL_DEPTH_TEST)
        glDisable(GL_LIGHTING)
        glBindTexture(GL_TEXTURE_2D, 0)
        glEnable(GL_BLEND)
        glBlendFunc(GL_SRC_ALPHA, GL_ONE_MINUS_SRC_ALPHA)

        glMatrixMode(GL_PROJECTION)
        glPushMatrix()
        glLoadIdentity()
        gluOrtho2D(0, view[2], 0, view[3])
        glMatrixMode(GL_MODELVIEW)
        glPushMatrix()
        glLoadIdentity()

        glColor4f(0.3, 0.3, 0.3, 0.5)
        glBegin(GL_QUADS)
        glVertex2f(0, view[3]-60)
        glVertex2f(self.length, view[3]-60)
        glVertex2f(self.length, view[3])
        glVertex2f(0, view[3])
        glEnd()

        glColor4f(1,1,1,1)
        glBegin(GL_LINE_STRIP)
        for i in range(len(self.frames)):
            glVertex2f(i, self.frames[i]/self.max*60+bge.render.getWindowHeight()-60)
        glEnd()

        glColor4f(0,0,0,1)
        glBegin(GL_LINE_LOOP)
        glVertex2f(-1, view[3]-60)
        glVertex2f(self.length+1, view[3]-60)
        glVertex2f(self.length+1, view[3]+1)
        glVertex2f(-1, view[3]+1)
        glEnd()

        glPopMatrix()
        glMatrixMode(GL_PROJECTION)
        glPopMatrix()
        glPopAttrib()

    def main(self):
        self.cur_frame += 1
        average_fps = bge.logic.getAverageFrameRate()
        if self.cur_frame > self.last_push + 1/self.ratio:
            self.frames.append(average_fps)
            if len(self.frames) >= self.length:
                self.frames.pop(0)

        if self.visible:
            if self.render not in bge.logic.getCurrentScene().post_draw:
                bge.logic.getCurrentScene().post_draw.append(self.render)
        else:
            if self.render in bge.logic.getCurrentScene().post_draw:
                bge.logic.getCurrentScene().post_draw.remove(self.render)

def main(cont):
    if not '_profiler' in bge.logic.globalDict:
        bge.logic.globalDict['_profiler'] = Profiler()

    bge.logic.globalDict['_profiler'].main()