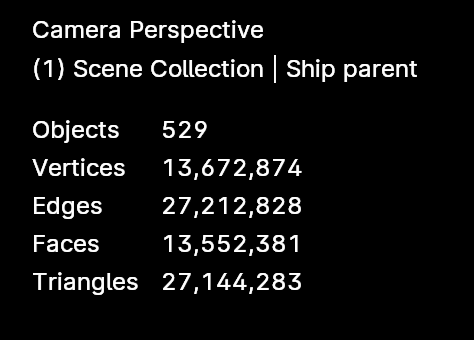
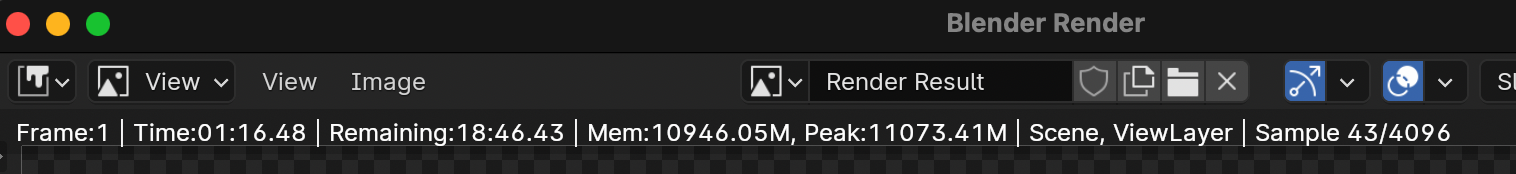
For the past few months I’ve been leaving Blender rendering a project rendering overnight in my Mac Studio M1 Ultra. This project crashes at random about half the nights, and that would be about two months of rendering almost every single night.
Making it much harder to troubleshoot is that sometimes it crashes after a few frames, sometimes after dozens of frames, and sometimes not at all.
The macOS crash log for Blender is gigantic, but I’ve read that the important stuff is near the top, so here it is:
Process:               Blender [46245]
Path:                  /Applications/Blender.app/Contents/MacOS/Blender
Identifier:            org.blenderfoundation.blender
Version:               4.1.0 (4.1.0 2024-03-26)
Code Type:             ARM-64 (Native)
Parent Process:        launchd [1]
User ID:               501

Date/Time:             2024-04-20 03:16:50.8493 -0400
OS Version:            macOS 14.4.1 (23E224)
Report Version:        12
Anonymous UUID:        55AF7720-02C9-926E-C7DA-7319E4A60559


Time Awake Since Boot: 470000 seconds

System Integrity Protection: enabled

Crashed Thread:        63

Exception Type:        EXC_BAD_ACCESS (SIGSEGV)
Exception Codes:       KERN_INVALID_ADDRESS at 0x910043fda9017c05 -> 0x000043fda9017c05 (possible pointer authentication failure)
Exception Codes:       0x0000000000000001, 0x910043fda9017c05

Termination Reason:    Namespace SIGNAL, Code 11 Segmentation fault: 11
Terminating Process:   exc handler [46245]

VM Region Info: 0x43fda9017c05 is not in any region.  Bytes after previous region: 74256780196870  Bytes before following region: 30796375032827
      REGION TYPE                    START - END         [ VSIZE] PRT/MAX SHRMOD  REGION DETAIL
      MALLOC_MEDIUM              7460000000-7468000000   [128.0M] rw-/rwx SM=PRV
--->  GAP OF 0x5f8b98000000 BYTES
      MALLOC_NANO              600000000000-600020000000 [512.0M] rw-/rwx SM=PRV
And it starts listing all the threads, until it gets to 63, which is the one that crashed and it shows all this:
Thread 63 Crashed:
0   libtbb.dylib                  	       0x10d43aacc void tbb::internal::generic_scheduler::propagate_task_group_state<unsigned long>(unsigned long tbb::task_group_context::*, tbb::task_group_context&, unsigned long) + 192
1   libtbb.dylib                  	       0x10d43a3d0 bool tbb::internal::market::propagate_task_group_state<unsigned long>(unsigned long tbb::task_group_context::*, tbb::task_group_context&, unsigned long) + 240
2   libtbb.dylib                  	       0x10d43a2dc tbb::task_group_context::cancel_group_execution() + 140
3   libtbb.dylib                  	       0x10d438130 tbb::internal::custom_scheduler<tbb::internal::IntelSchedulerTraits>::local_wait_for_all(tbb::task&, tbb::task*) + 412
4   libtbb.dylib                  	       0x10d435ac8 tbb::internal::generic_scheduler::spawn_root_and_wait(tbb::task&, tbb::task*&) + 224
5   libembree4.dylib              	       0x10e62bbfc embree::AccelN::accels_build() + 228
6   libembree4.dylib              	       0x10e670824 embree::Scene::build_cpu_accels() + 1100
7   libembree4.dylib              	       0x10e670c4c embree::Scene::commit_task() + 528
8   libembree4.dylib              	       0x10e673154 tbb::interface9::internal::start_for<tbb::blocked_range<unsigned long>, tbb::internal::parallel_for_body<embree::Scene::commit(bool)::$_4::operator()() const::'lambda'()::operator()() const::'lambda'(unsigned long), unsigned long>, tbb::auto_partitioner const>::execute() + 1092
9   libtbb.dylib                  	       0x10d4389c0 tbb::internal::custom_scheduler<tbb::internal::IntelSchedulerTraits>::process_bypass_loop(tbb::internal::context_guard_helper<false>&, tbb::task*, long) + 428
10  libtbb.dylib                  	       0x10d438058 tbb::internal::custom_scheduler<tbb::internal::IntelSchedulerTraits>::local_wait_for_all(tbb::task&, tbb::task*) + 196
11  libtbb.dylib                  	       0x10d435ac8 tbb::internal::generic_scheduler::spawn_root_and_wait(tbb::task&, tbb::task*&) + 224
12  libembree4.dylib              	       0x10e672cd8 tbb::internal::function_task<embree::Scene::commit(bool)::$_4::operator()() const::'lambda'()>::execute() + 144
13  libtbb.dylib                  	       0x10d4389c0 tbb::internal::custom_scheduler<tbb::internal::IntelSchedulerTraits>::process_bypass_loop(tbb::internal::context_guard_helper<false>&, tbb::task*, long) + 428
14  libtbb.dylib                  	       0x10d438058 tbb::internal::custom_scheduler<tbb::internal::IntelSchedulerTraits>::local_wait_for_all(tbb::task&, tbb::task*) + 196
15  libembree4.dylib              	       0x10e672a78 tbb::internal::task_group_base::wait() + 40
16  libembree4.dylib              	       0x10e672a38 tbb::internal::wait_delegate::operator()() const + 24
17  libtbb.dylib                  	       0x10d426890 tbb::interface7::internal::isolate_within_arena(tbb::interface7::internal::delegate_base&, long) + 92
18  libembree4.dylib              	       0x10e672bbc std::__1::__function::__func<embree::Scene::commit(bool)::$_4, std::__1::allocator<embree::Scene::commit(bool)::$_4>, void ()>::operator()() + 132
19  libembree4.dylib              	       0x10e670ed4 embree::Scene::commit(bool) + 156
20  libembree4.dylib              	       0x10e63d20c rtcCommitScene + 52
21  Blender                       	       0x104ab9d6c ccl::BVHEmbree::build(ccl::Progress&, ccl::Stats*, RTCDeviceTy*, bool) + 476
22  Blender                       	       0x104ac82f8 ccl::CPUDevice::build_bvh(ccl::BVH*, ccl::Progress&, bool) + 144
23  Blender                       	       0x104acb2b4 ccl::MultiDevice::build_bvh(ccl::BVH*, ccl::Progress&, bool) + 744
24  Blender                       	       0x104c809a0 ccl::GeometryManager::device_update_bvh(ccl::Device*, ccl::DeviceScene*, ccl::Scene*, ccl::Progress&) + 648
25  Blender                       	       0x104c7b408 ccl::GeometryManager::device_update(ccl::Device*, ccl::DeviceScene*, ccl::Scene*, ccl::Progress&) + 4228
26  Blender                       	       0x104d04760 ccl::Scene::device_update(ccl::Device*, ccl::Progress&) + 1504
27  Blender                       	       0x104d064b0 ccl::Scene::update(ccl::Progress&) + 148
28  Blender                       	       0x104df4288 ccl::Session::run_update_for_next_iteration() + 1248
29  Blender                       	       0x104df3908 ccl::Session::run_main_render_loop() + 120
30  Blender                       	       0x104df47f0 ccl::Session::thread_render() + 252
31  Blender                       	       0x104df268c ccl::Session::thread_run() + 164
32  Blender                       	       0x104f193a0 ccl::thread::run(void*) + 28
33  libsystem_pthread.dylib       	       0x18de6ef94 _pthread_start + 136
34  libsystem_pthread.dylib       	       0x18de69d34 thread_start + 8
It goes all the way to thread 89, then another reference to thread 63:
Thread 63 crashed with ARM Thread State (64-bit):
    x0: 0x0000000000000001   x1: 0x0000000000000001   x2: 0x000000011ca8cf38   x3: 0x0000000000000001
    x4: 0x0000600018c85c00   x5: 0x0000000000003380   x6: 0x000060000135f380   x7: 0x000060000aa54f00
    x8: 0x000000011ca8cf28   x9: 0x0000000147752f48  x10: 0x910043fda9017bfd  x11: 0x0000000000633a00
   x12: 0x00000071c2800028  x13: 0x00000000ffff8030  x14: 0x0000000000000c00  x15: 0x00000000ffff7dff
   x16: 0x000000018de9f720  x17: 0x00006000009b0c30  x18: 0x0000000000000000  x19: 0x000000011ca8ce00
   x20: 0x0000000000000001  x21: 0x000000078cb49548  x22: 0x0000000000000078  x23: 0x0000000147752f58
   x24: 0x0000000000000000  x25: 0x0000000000000001  x26: 0x000000011ca8cf38  x27: 0x0000000000000001
   x28: 0x00000000ffffff00   fp: 0x000000078cb493b0   lr: 0x000000010d43aaa0
    sp: 0x000000078cb49350   pc: 0x000000010d43aacc cpsr: 0xa0001000
   far: 0x910043fda9017c05  esr: 0x92000005 (Data Abort) byte read Translation fault
There’s a lot more than that, but those lines in the log seem to be the ones related to this.
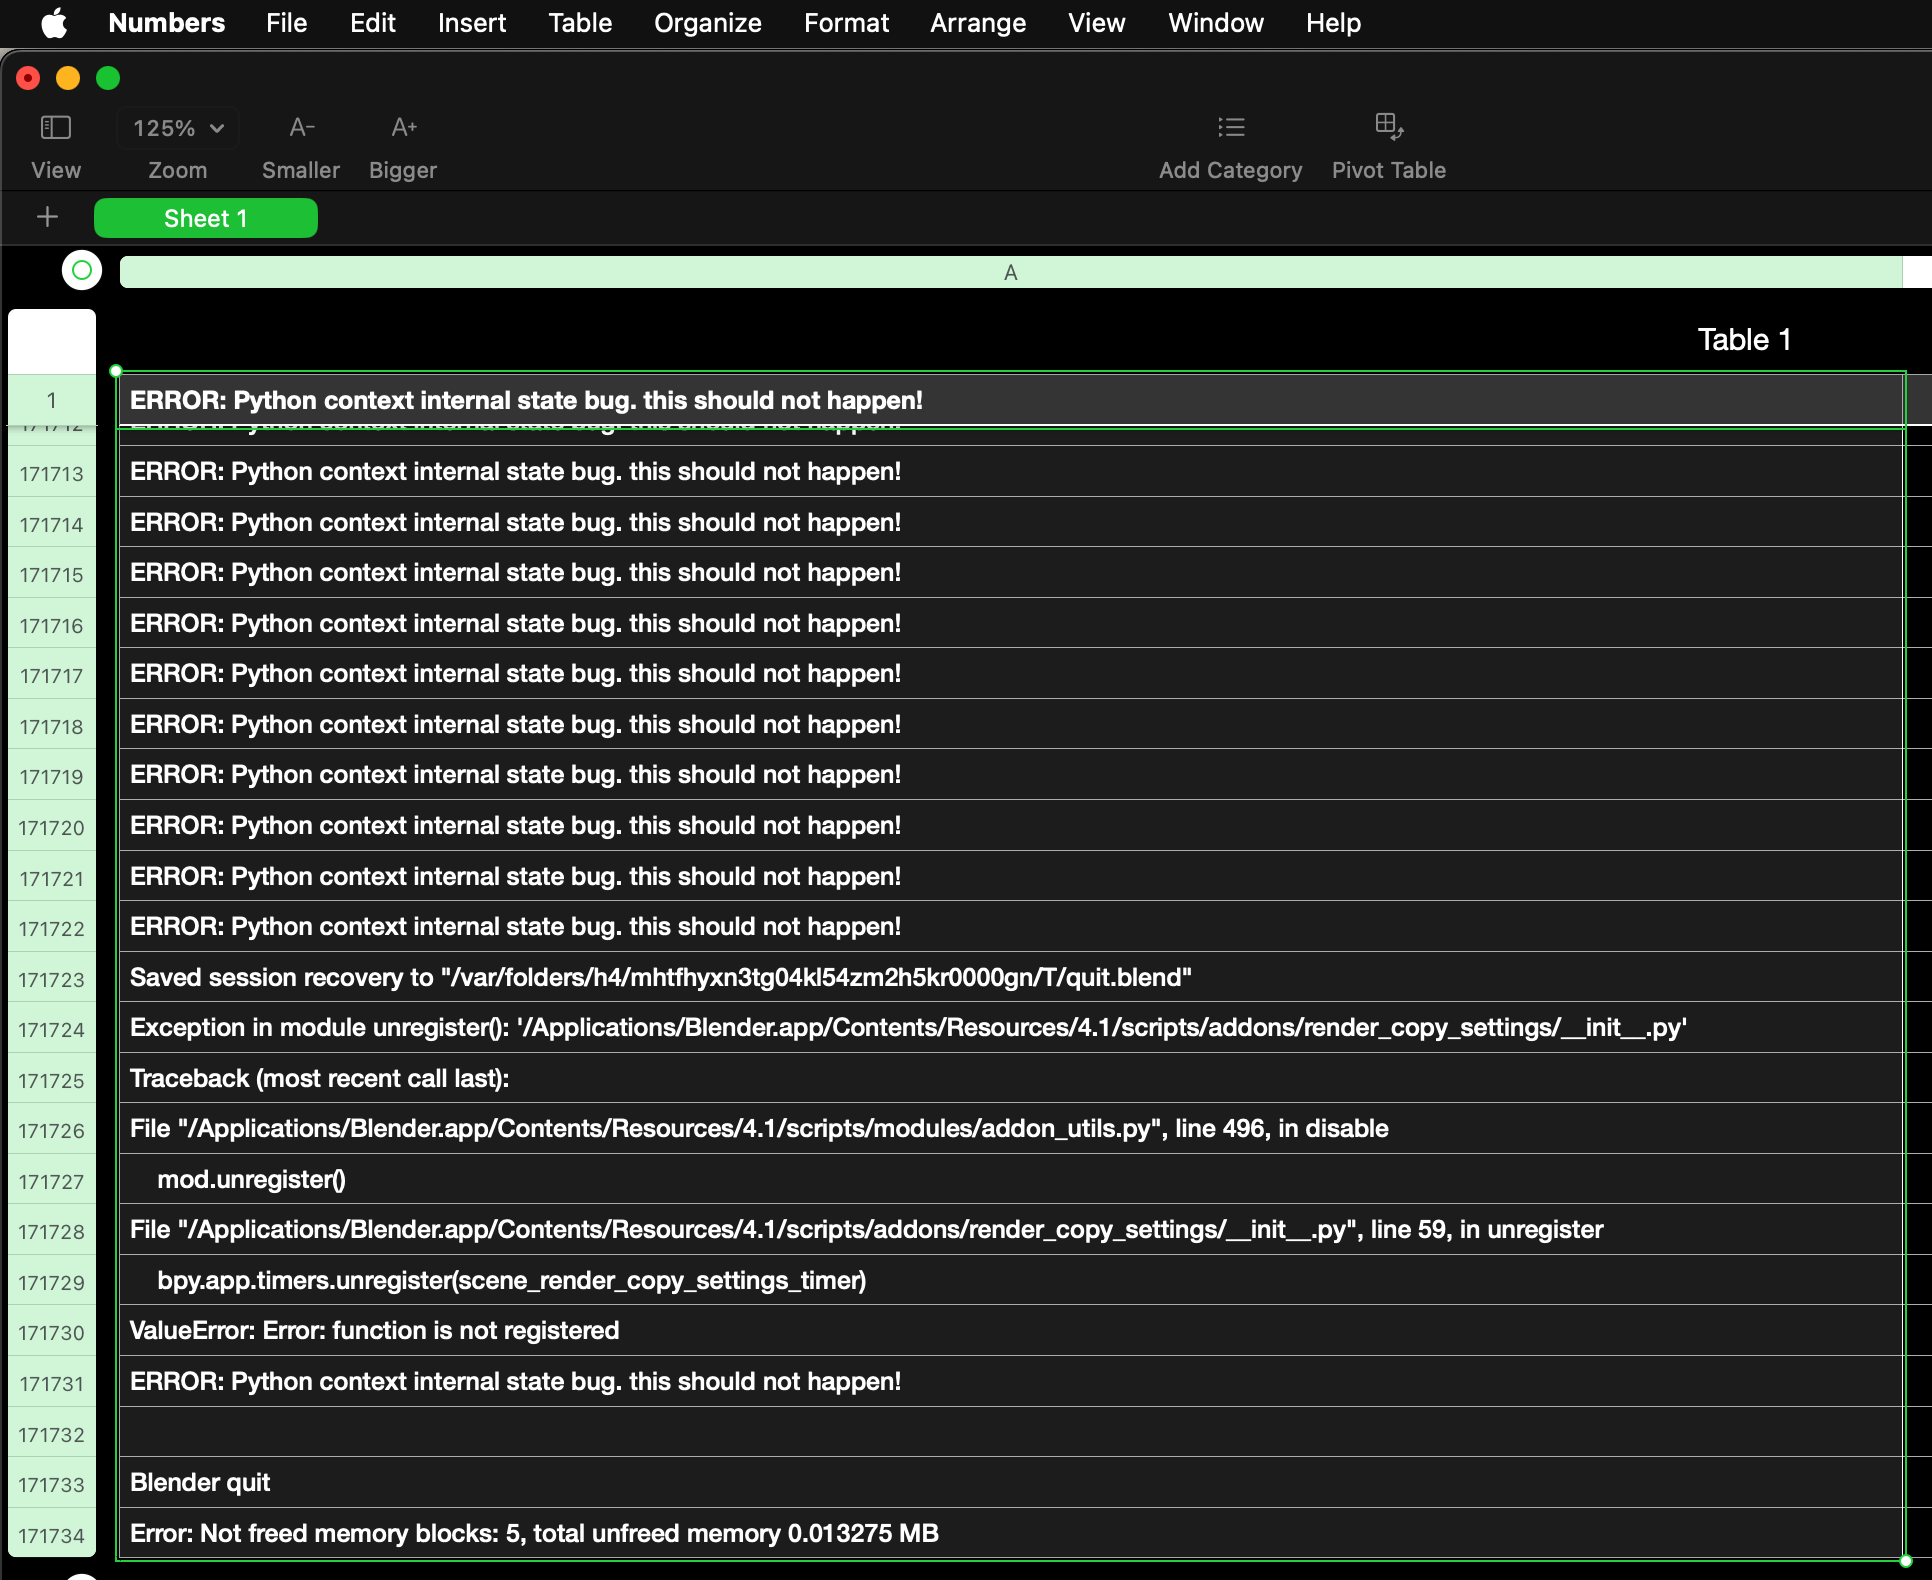
Now, doesn’t Blender have its own error log? Or anything that will give me a better idea as to why it’s crashing so often, and why it isn’t a specific frame or anything that’s triggering that error?