Hi.
I have been trying to solve a problem all week, and even started my Blender scene from scratch a couple of times, but I can’t get Geometry Nodes to work properly. I need help. The following explanation may be a bit long and detailed, but I’m trying to make sure I’m not doing anything wrong, and the details may help figure where I’m bungling things up. (Also, forgive me if it gets confusing, at any point: English is not my primary language).
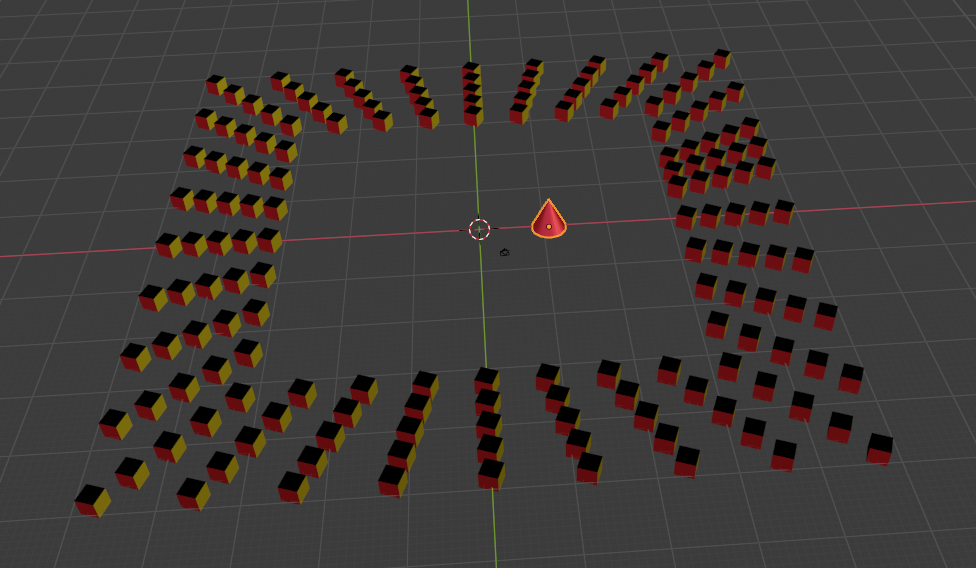
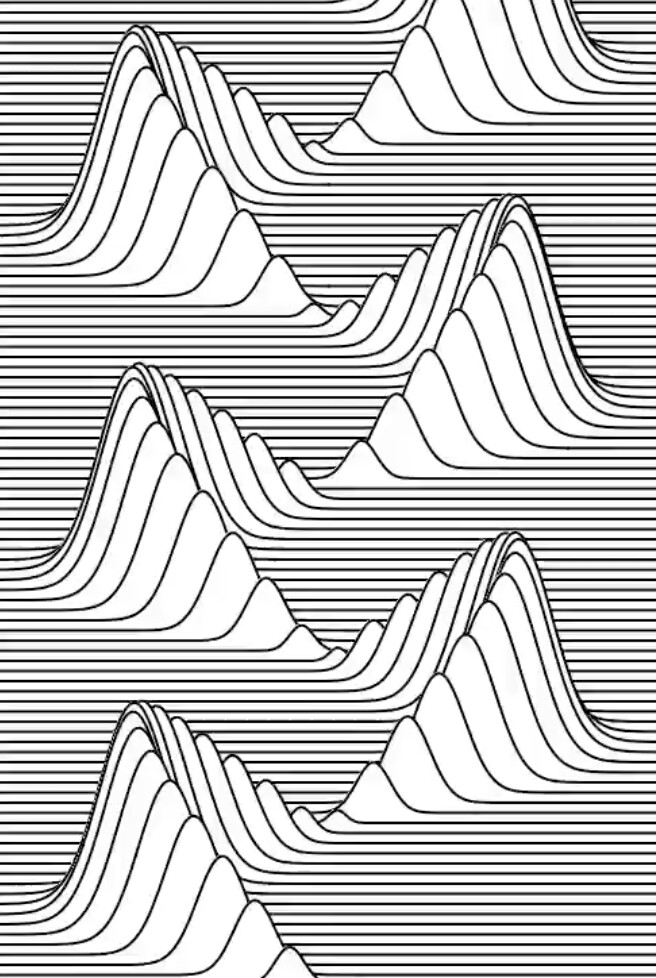
I saw this, done by a Twitter user named @Concinnus, (using other tools either than Blender) and I thought I’d implement something similar using Geometry Nodes:
The variation I’m going for uses the sine function of the X position to determine the Z position (I’ll have peaks AND valleys, but that’s OK: I believe it will look good). The sine function for each row is dislocated a bit, but it’s the same function.
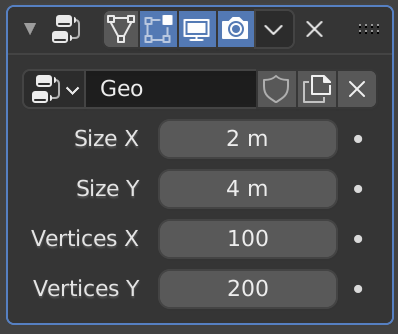
I have a grid 2m x 4m, with 100 vertices in the X axis and 200 in the Y axis:
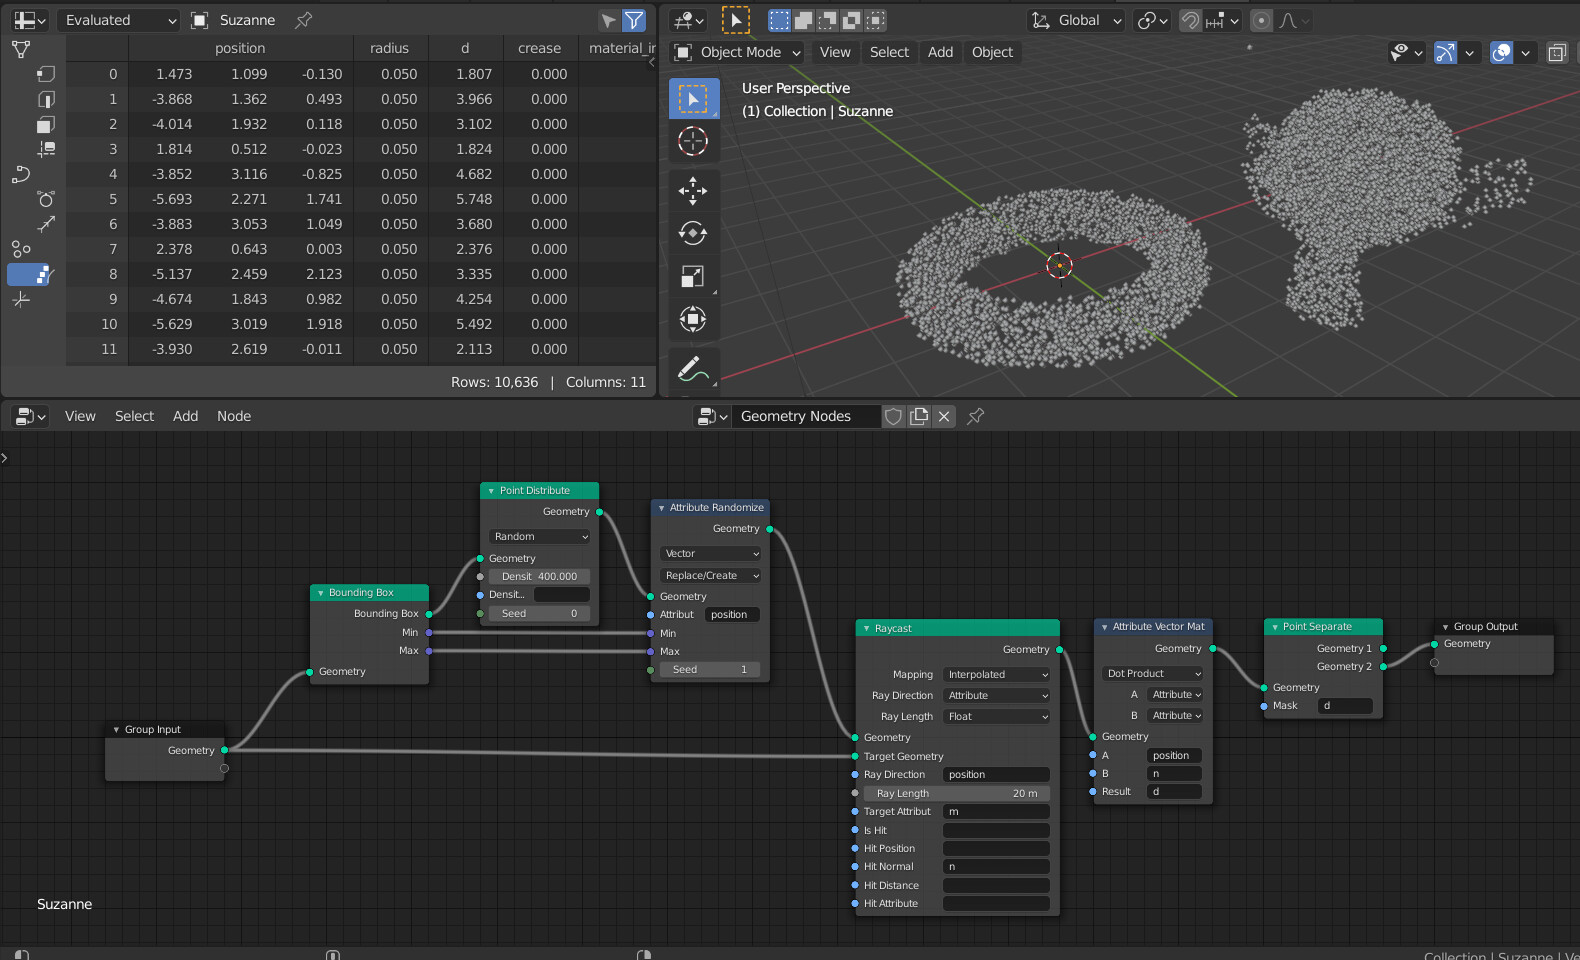
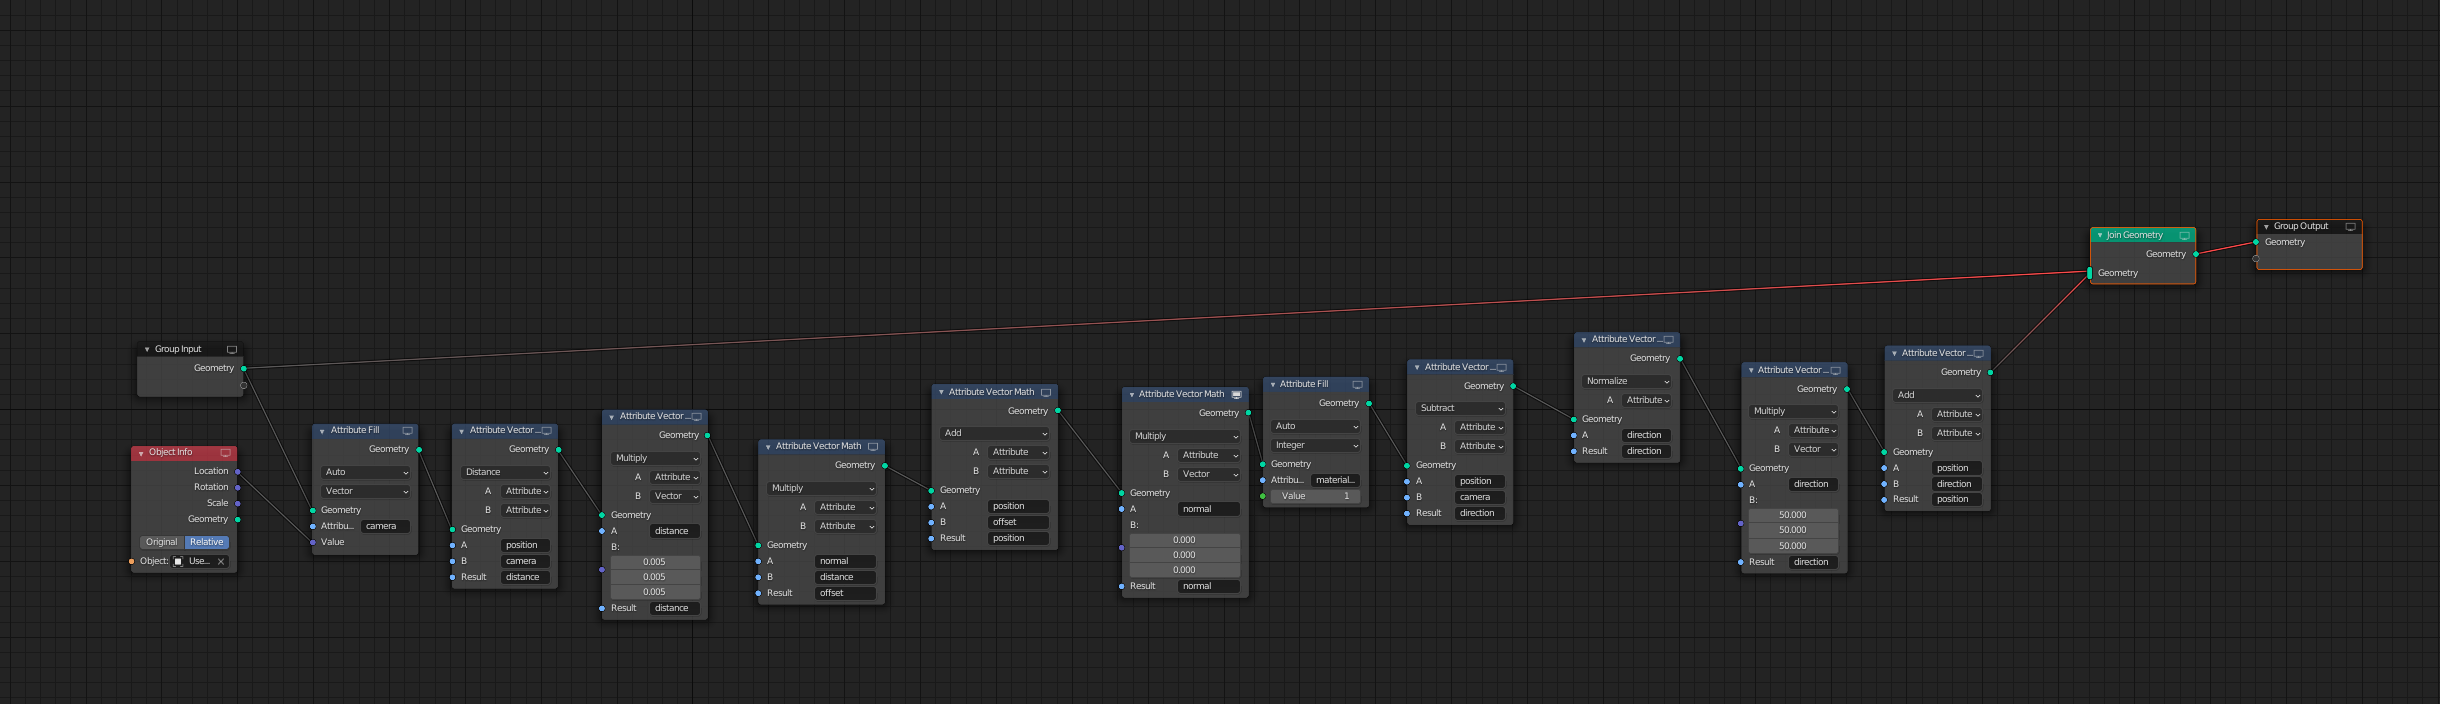
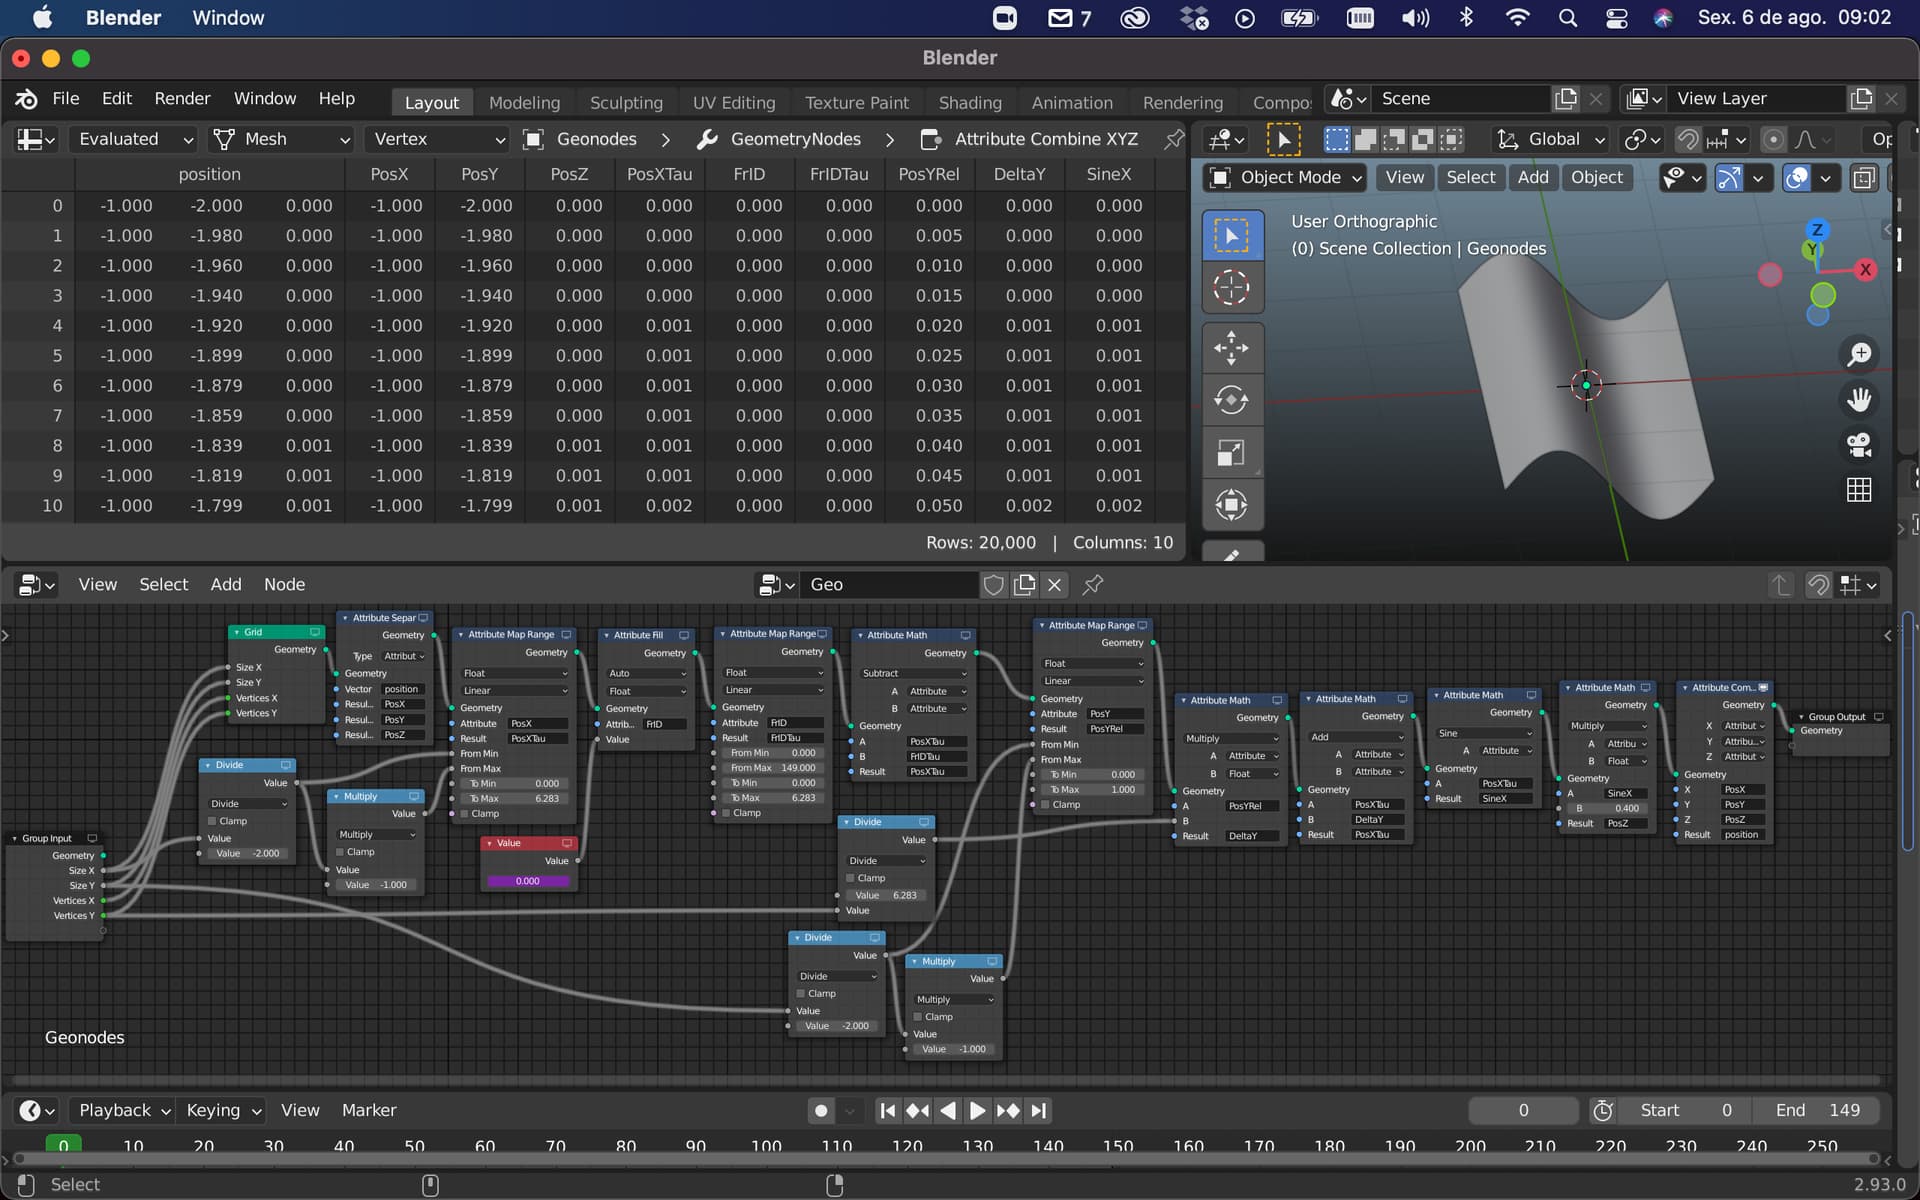
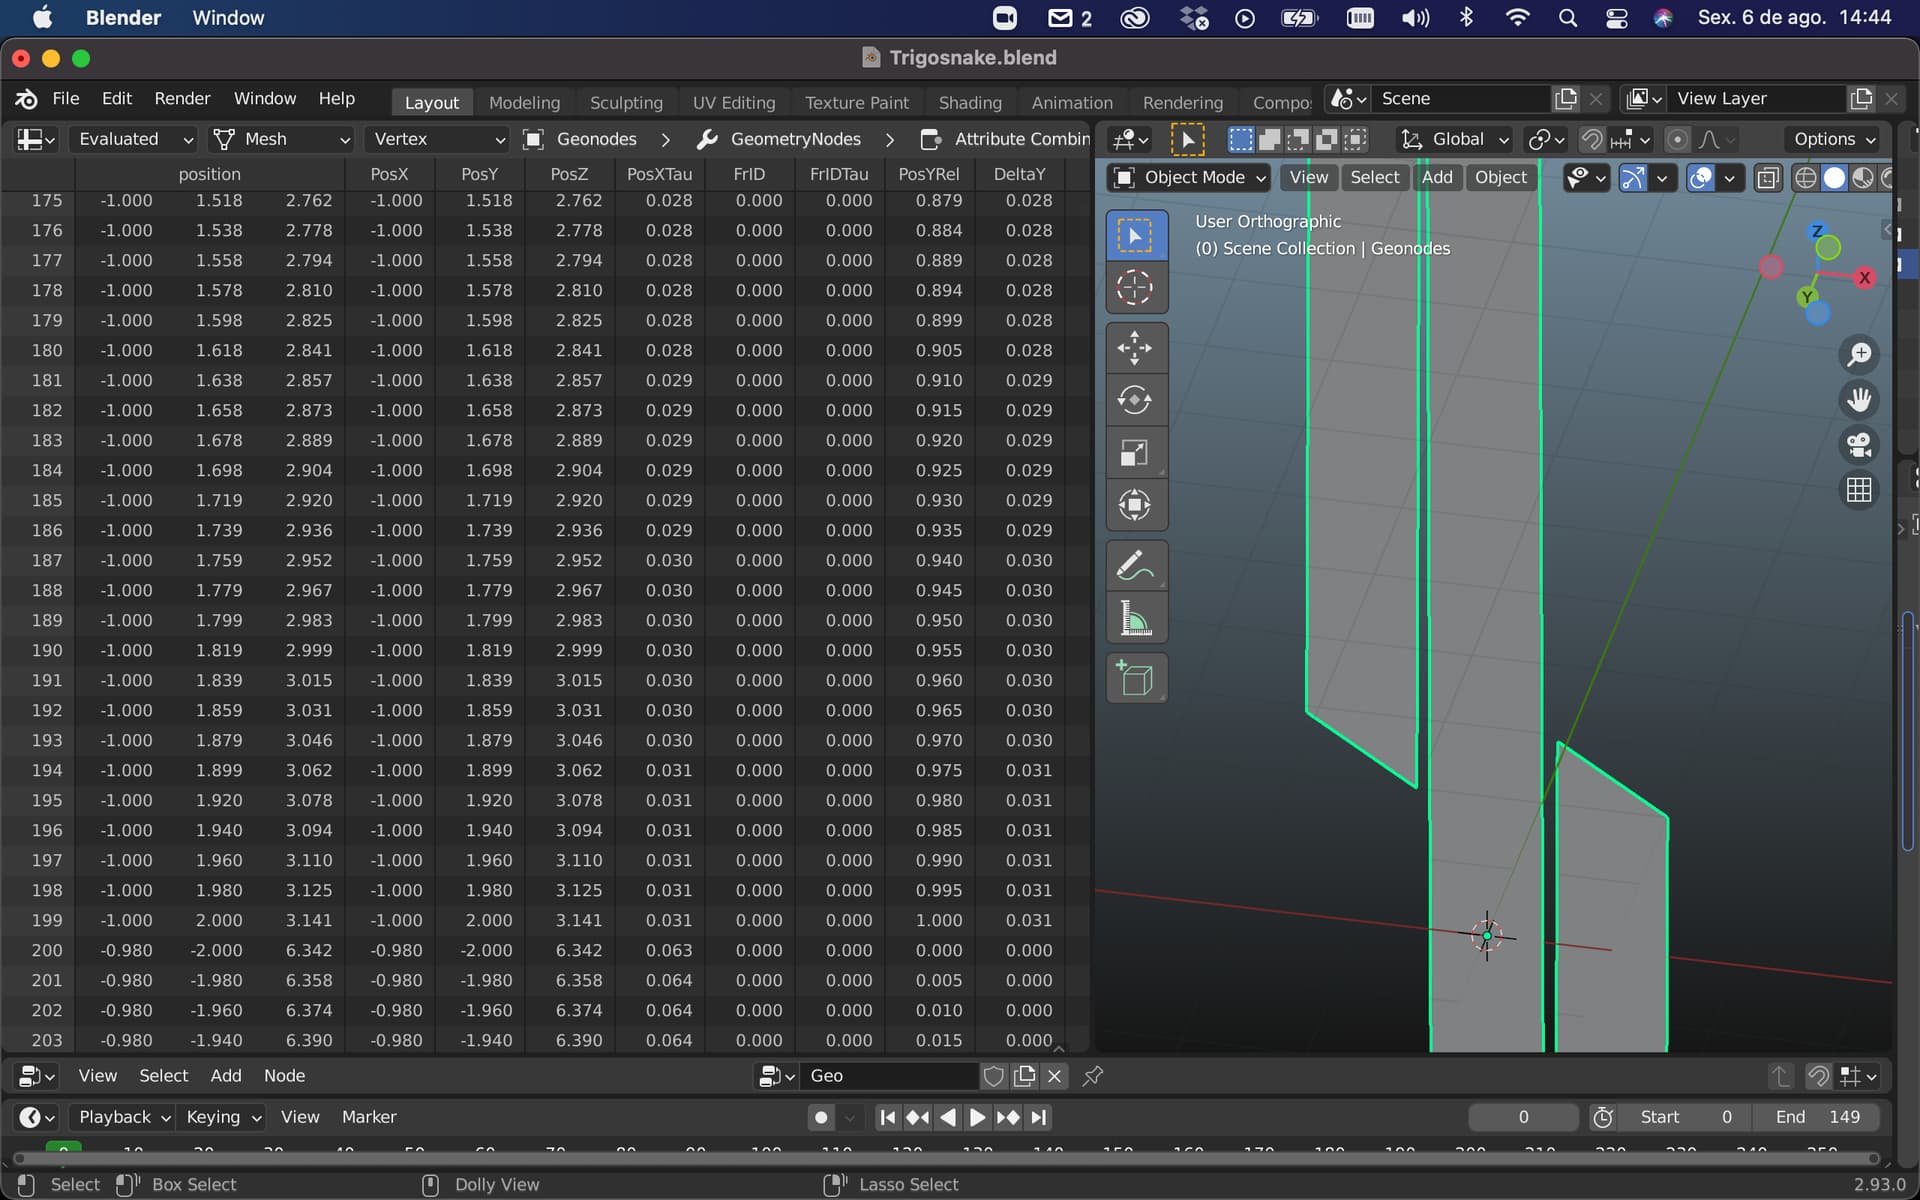
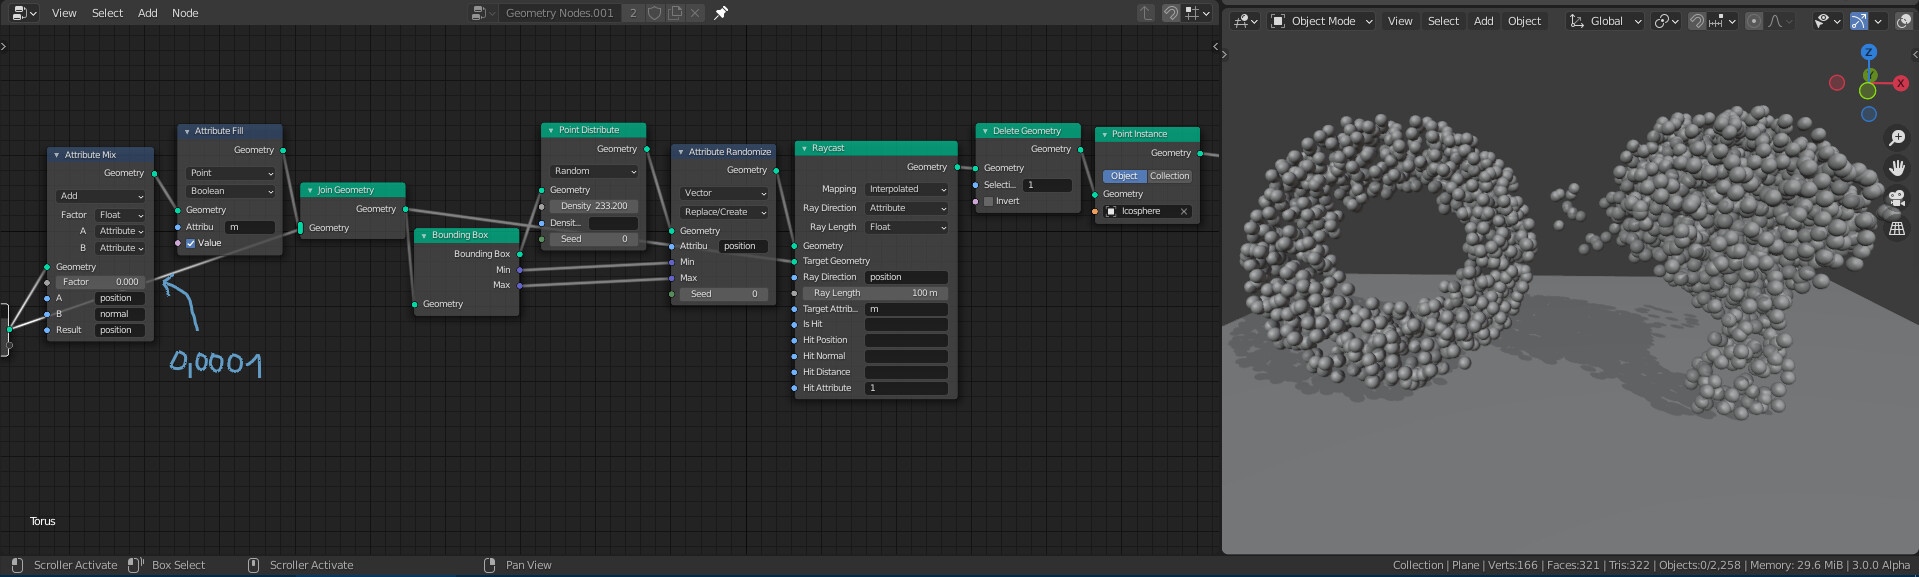
Here’s my node tree, with the spreadsheet and the erroneous result (in orthogonal view):
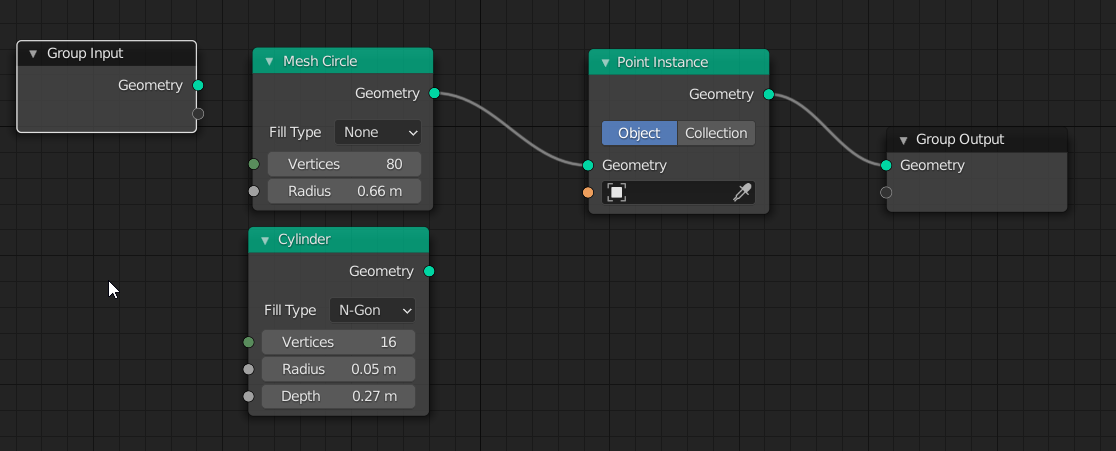
- I start by separating the position in PosX, PosY and PosZ.
- Then I map PosX from 0 to 2π (it’s a blessing just being able to type “tau” in the float field and see Blender gets it right). I store it in PosXTau.
- I use the Frame ID to animate the curve, so I map it also from 0 to 2π and subtract it from PosXTau.
Here’s where things start to get weird:
- I use PosY to shift the curve for each row. For such, first I map PosY to 0 to 1.
- Then I create DeltaY, which is 1/200 of 2π, 200 being the number of rows in the Y direction.
- I then proceed to add Delta Y to PosXTau and leave the result in PosXTau.
- I calculate the sine of PosXTau and store the result in PosZ
- I recombine the position vector with PosX, PosY and PosZ
The result should be my sine function sinuously curving in the y direction as well as in the X direction, but that doesn’t happen, as can be seen in the 3D View Port. It curves correctly along the X axis, but is “flat” along the Y axis.
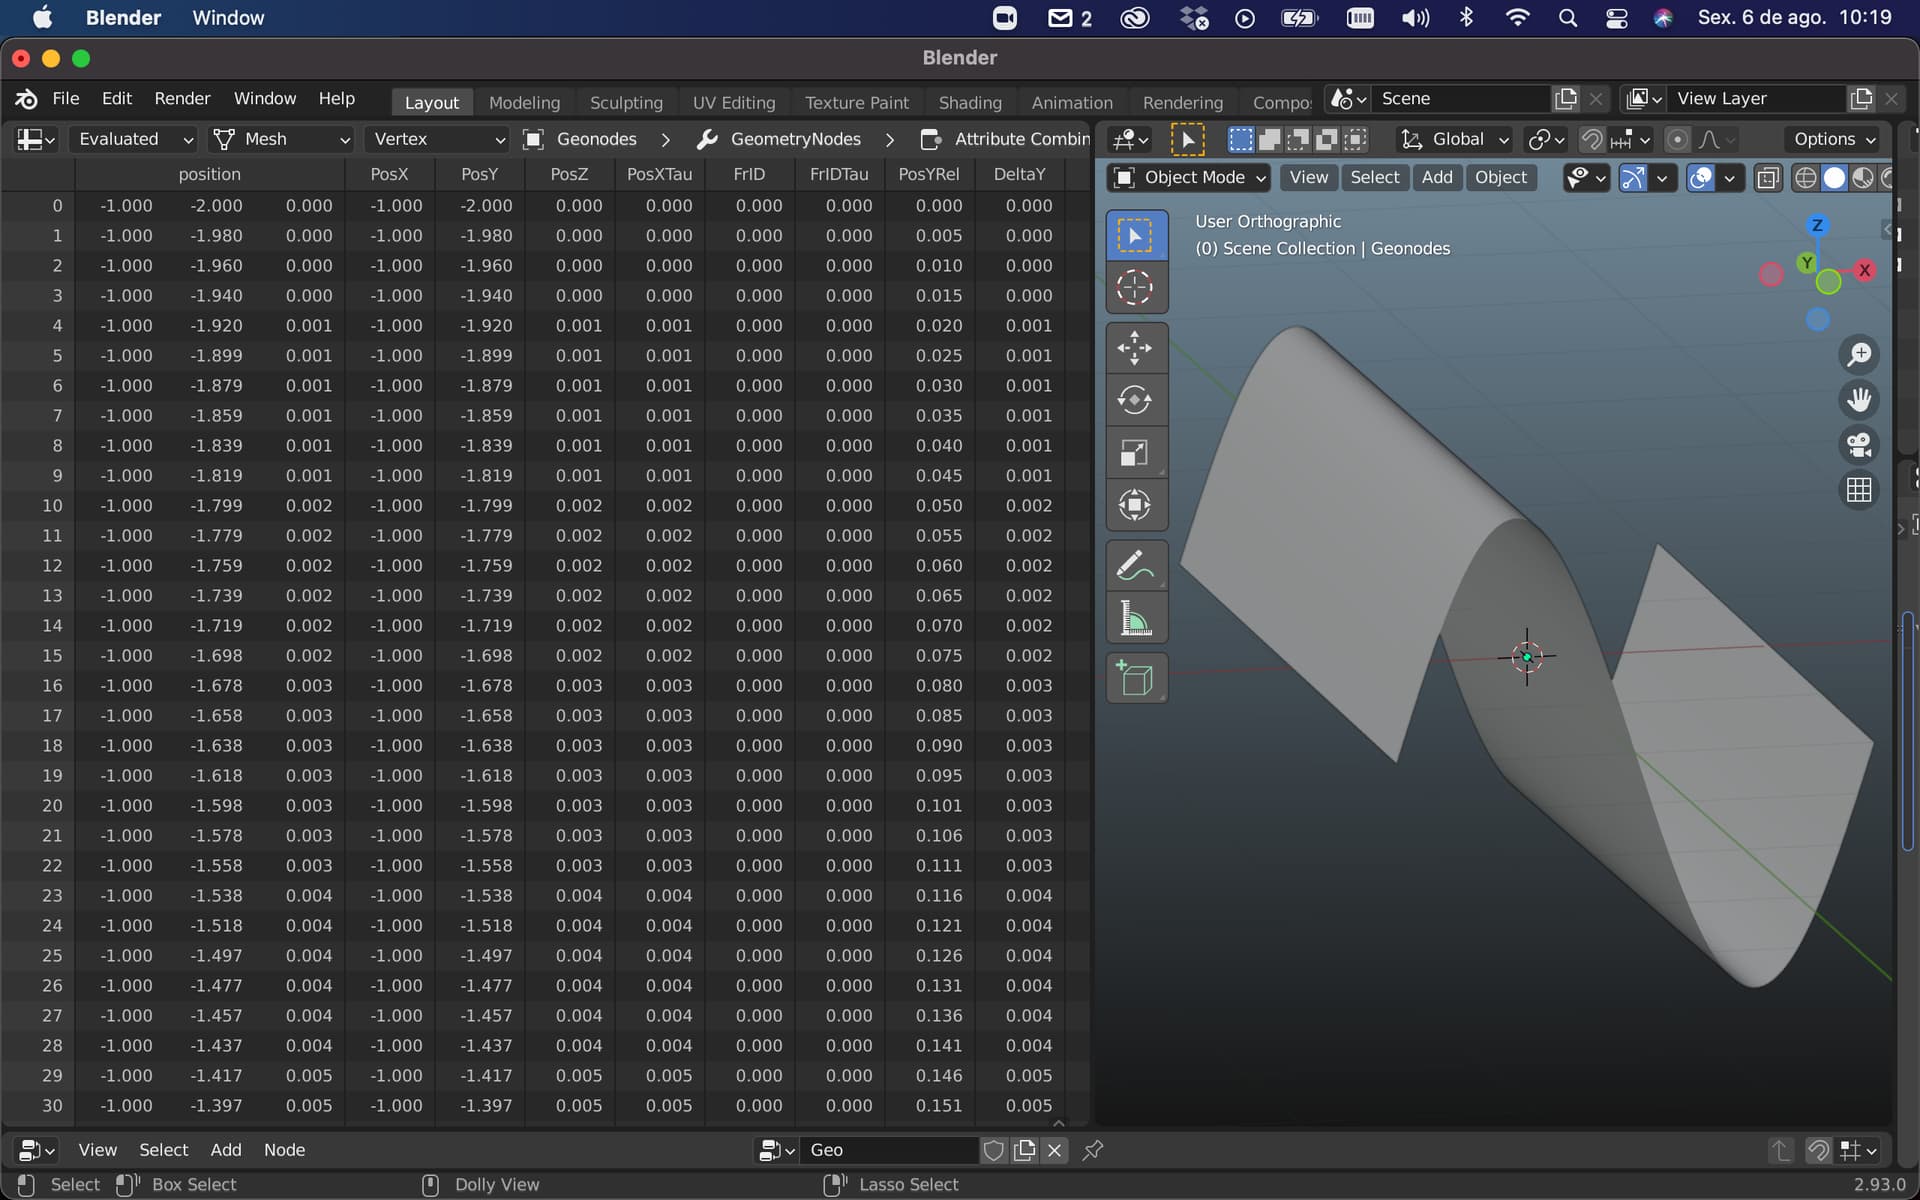
What gets me is that I can see with my own eyes that both PosZ and the z component of the position vector are, indeed varying along the Y axis, as can be seen in the spreadsheet but, alas, it remains flat in the 3D view:
Can anybody please explain what I’m doing wrong and help me get to the expected result?

 Do you think it could be made more effcient by using something like the dot product of the mesh normal and ray direction?