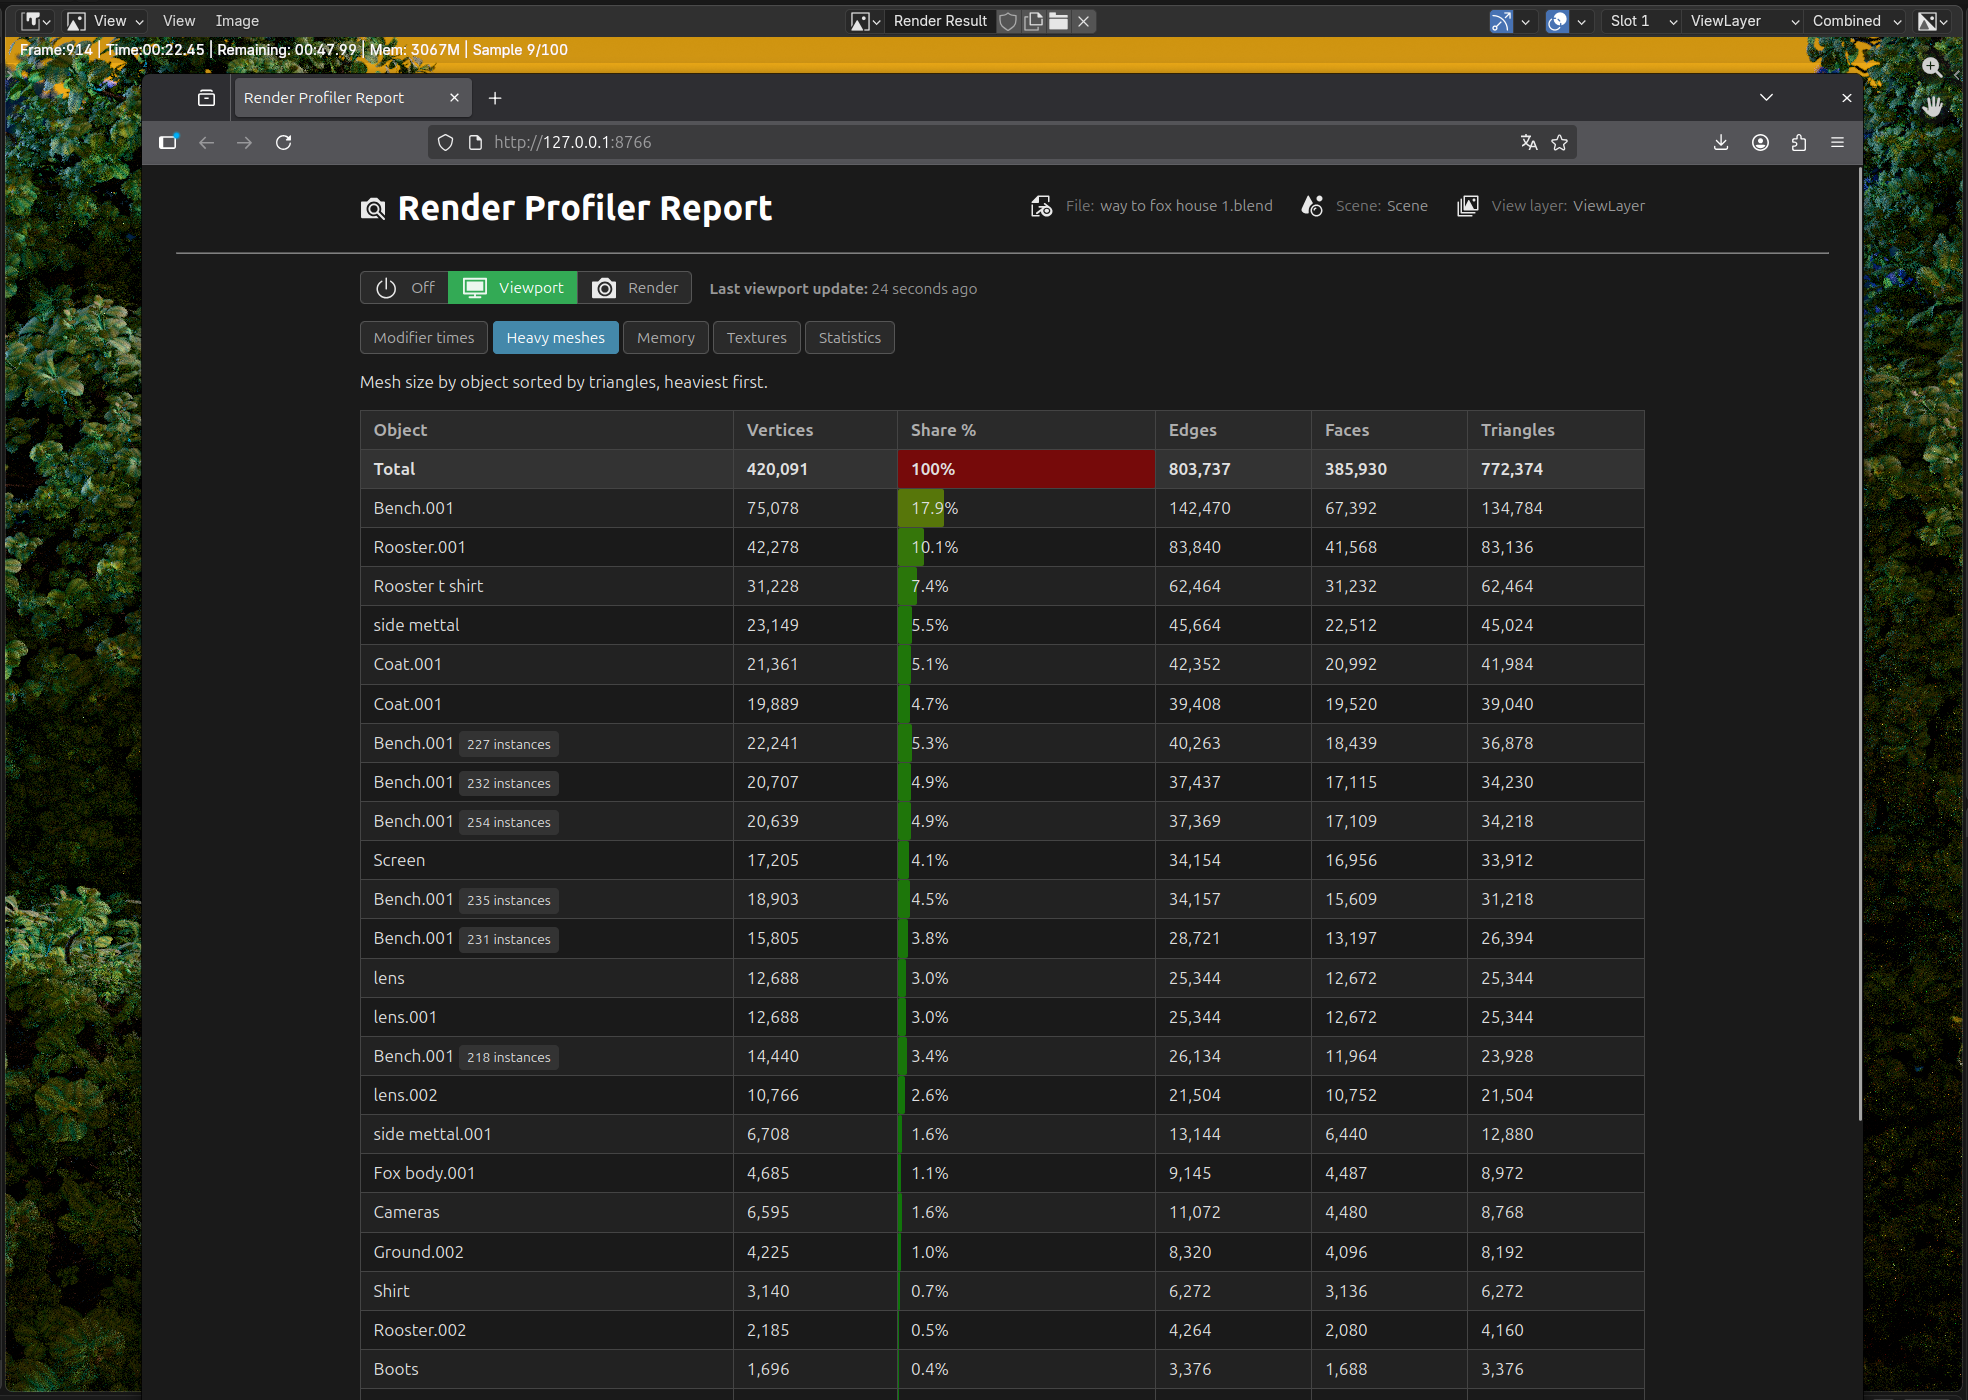
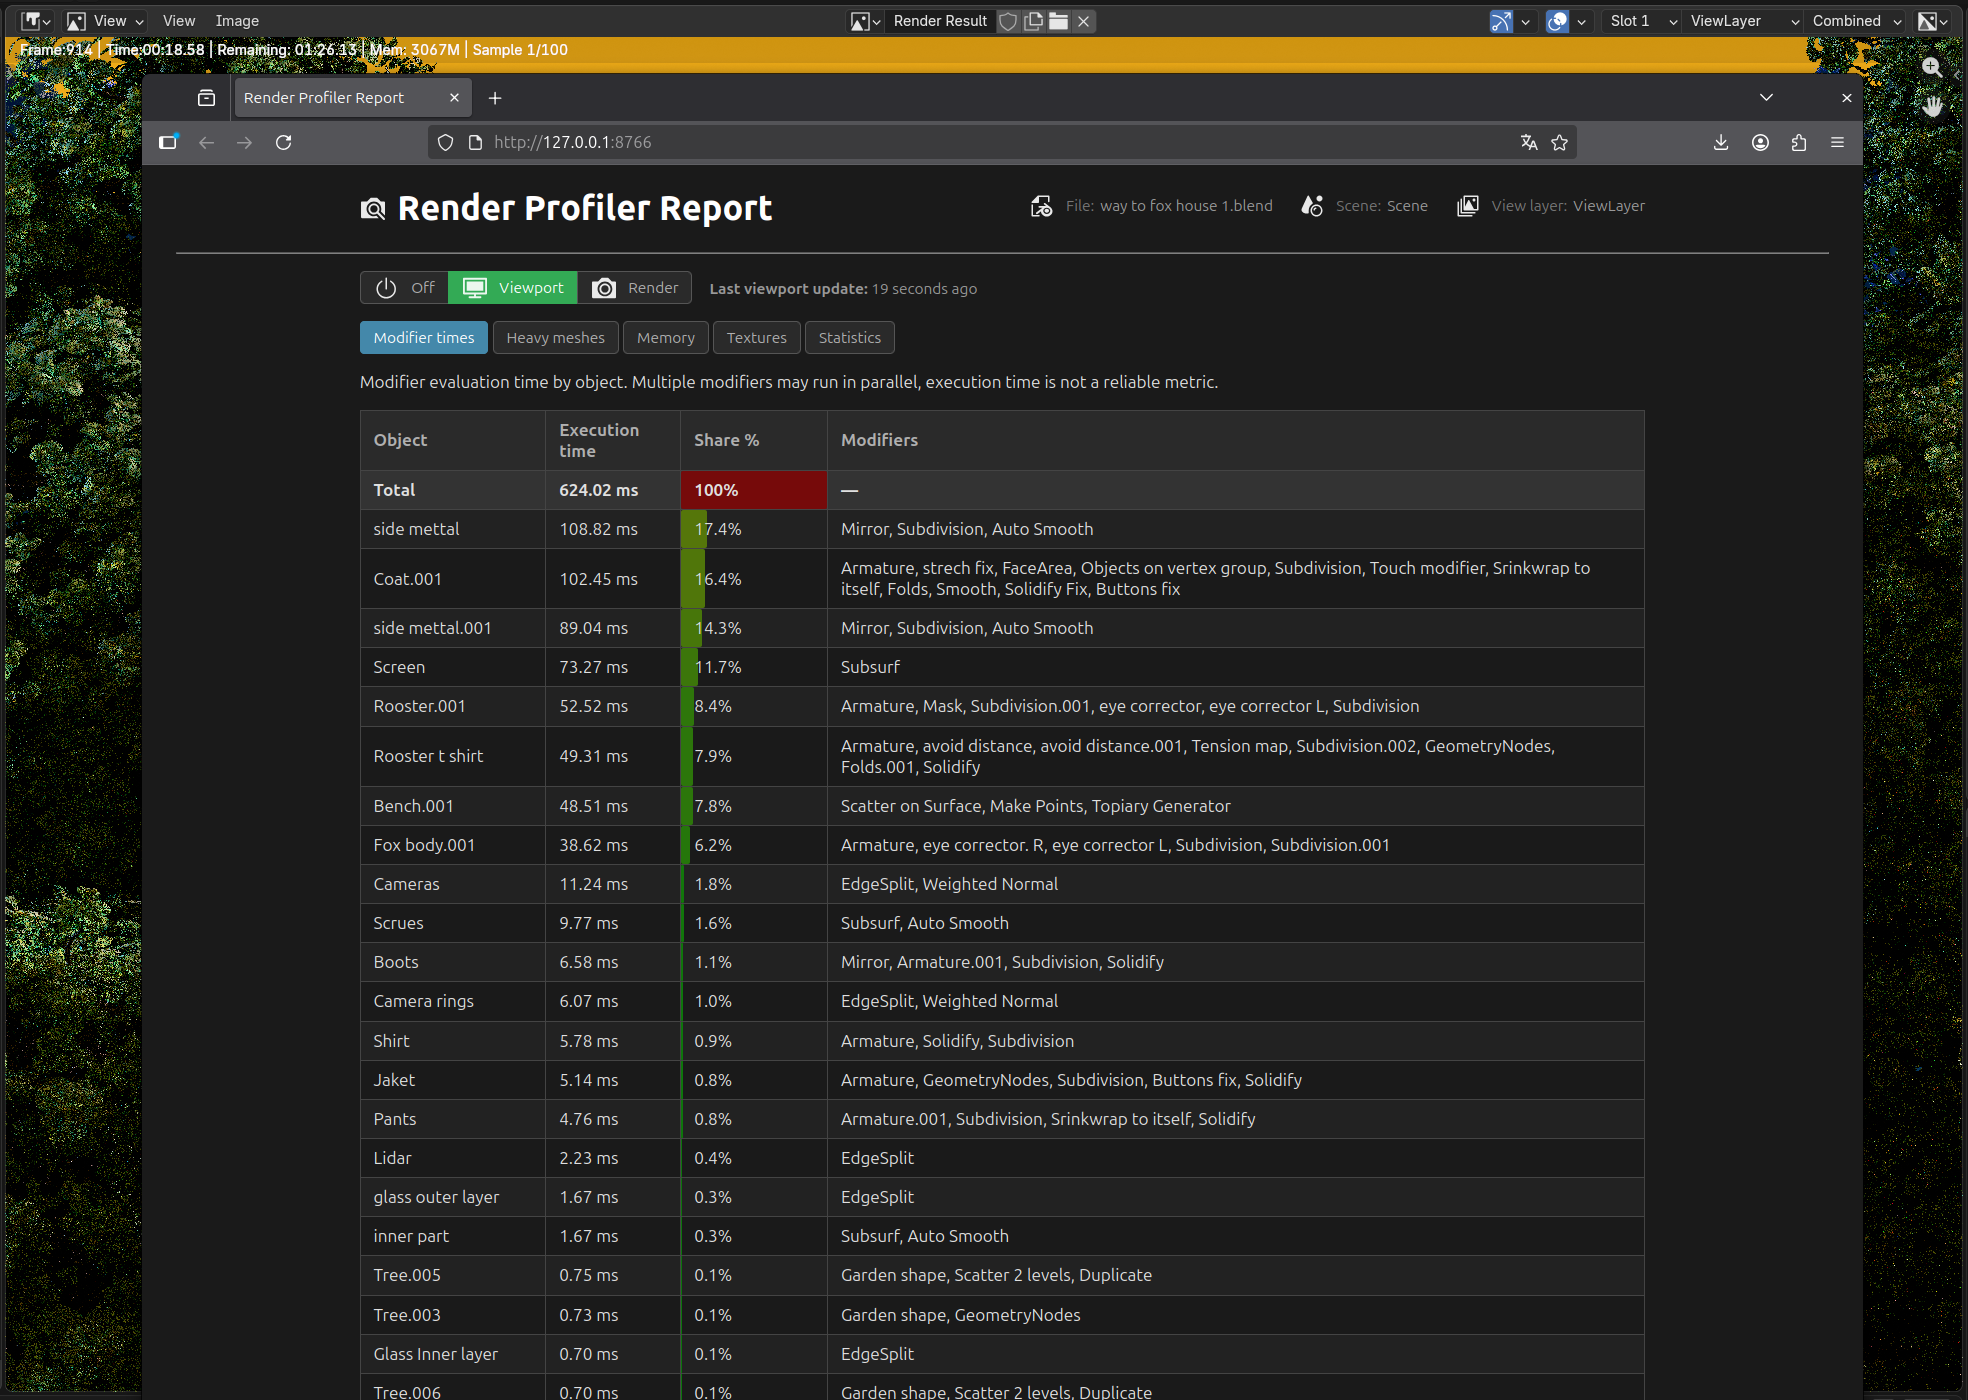
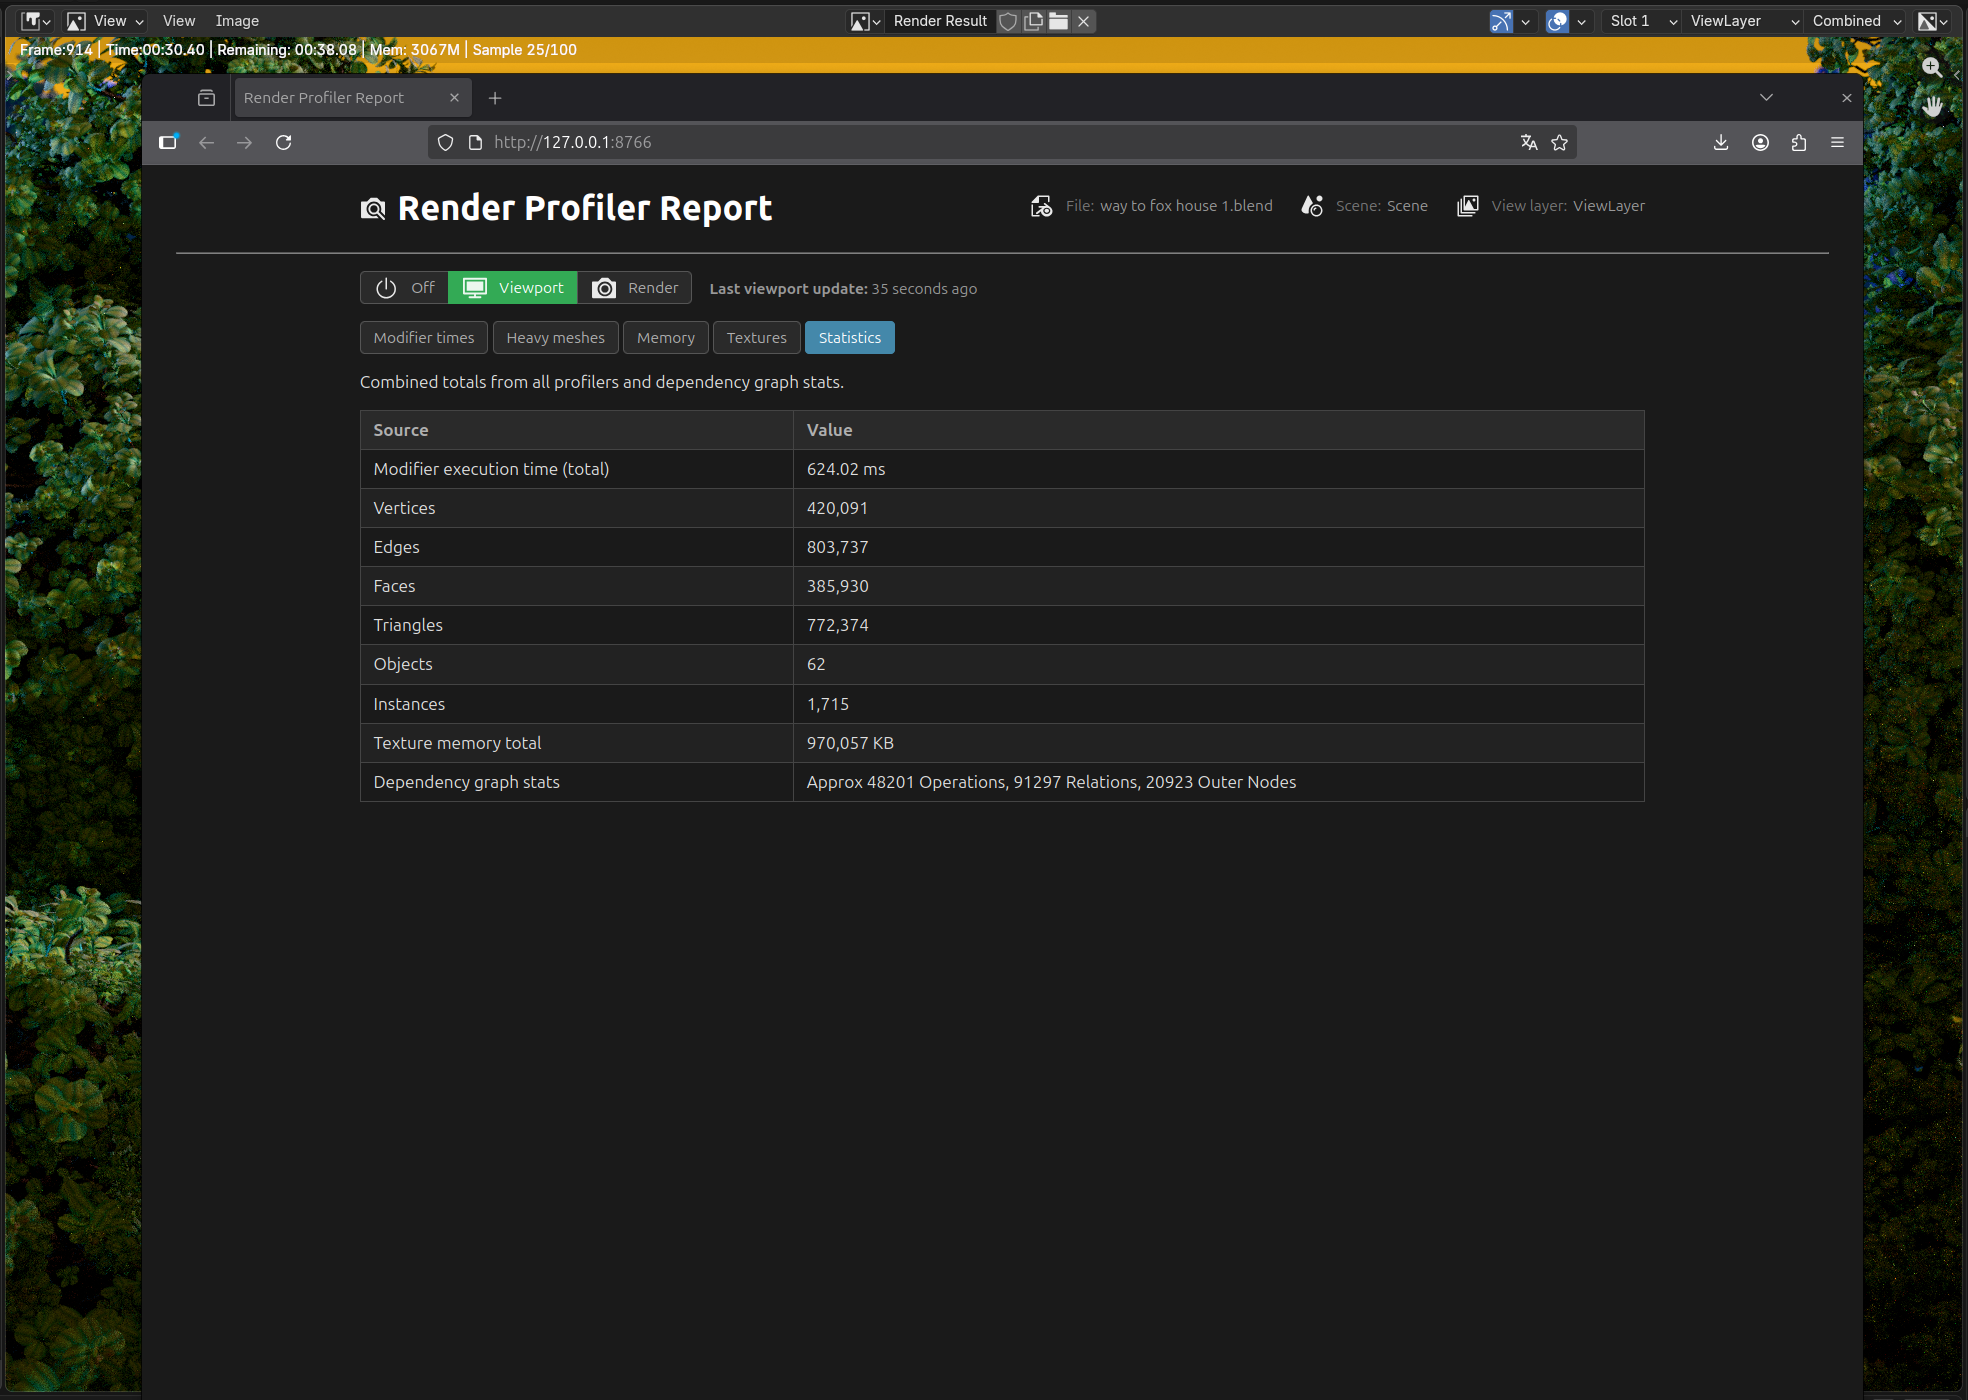
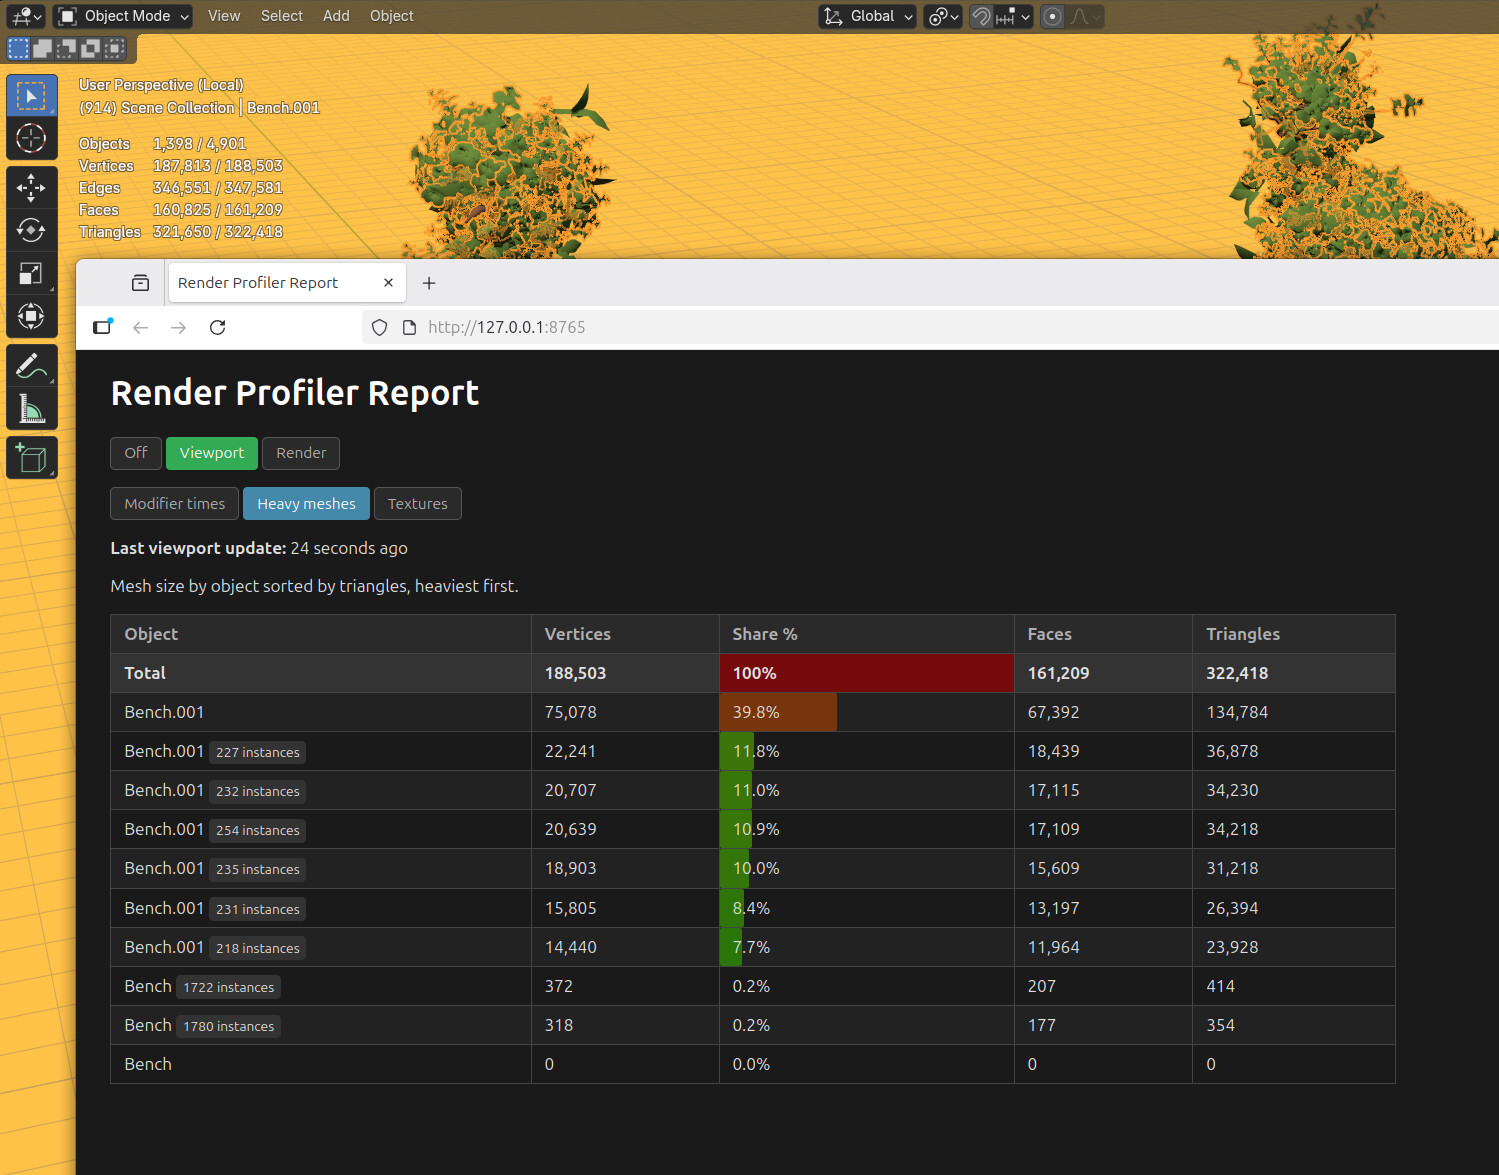
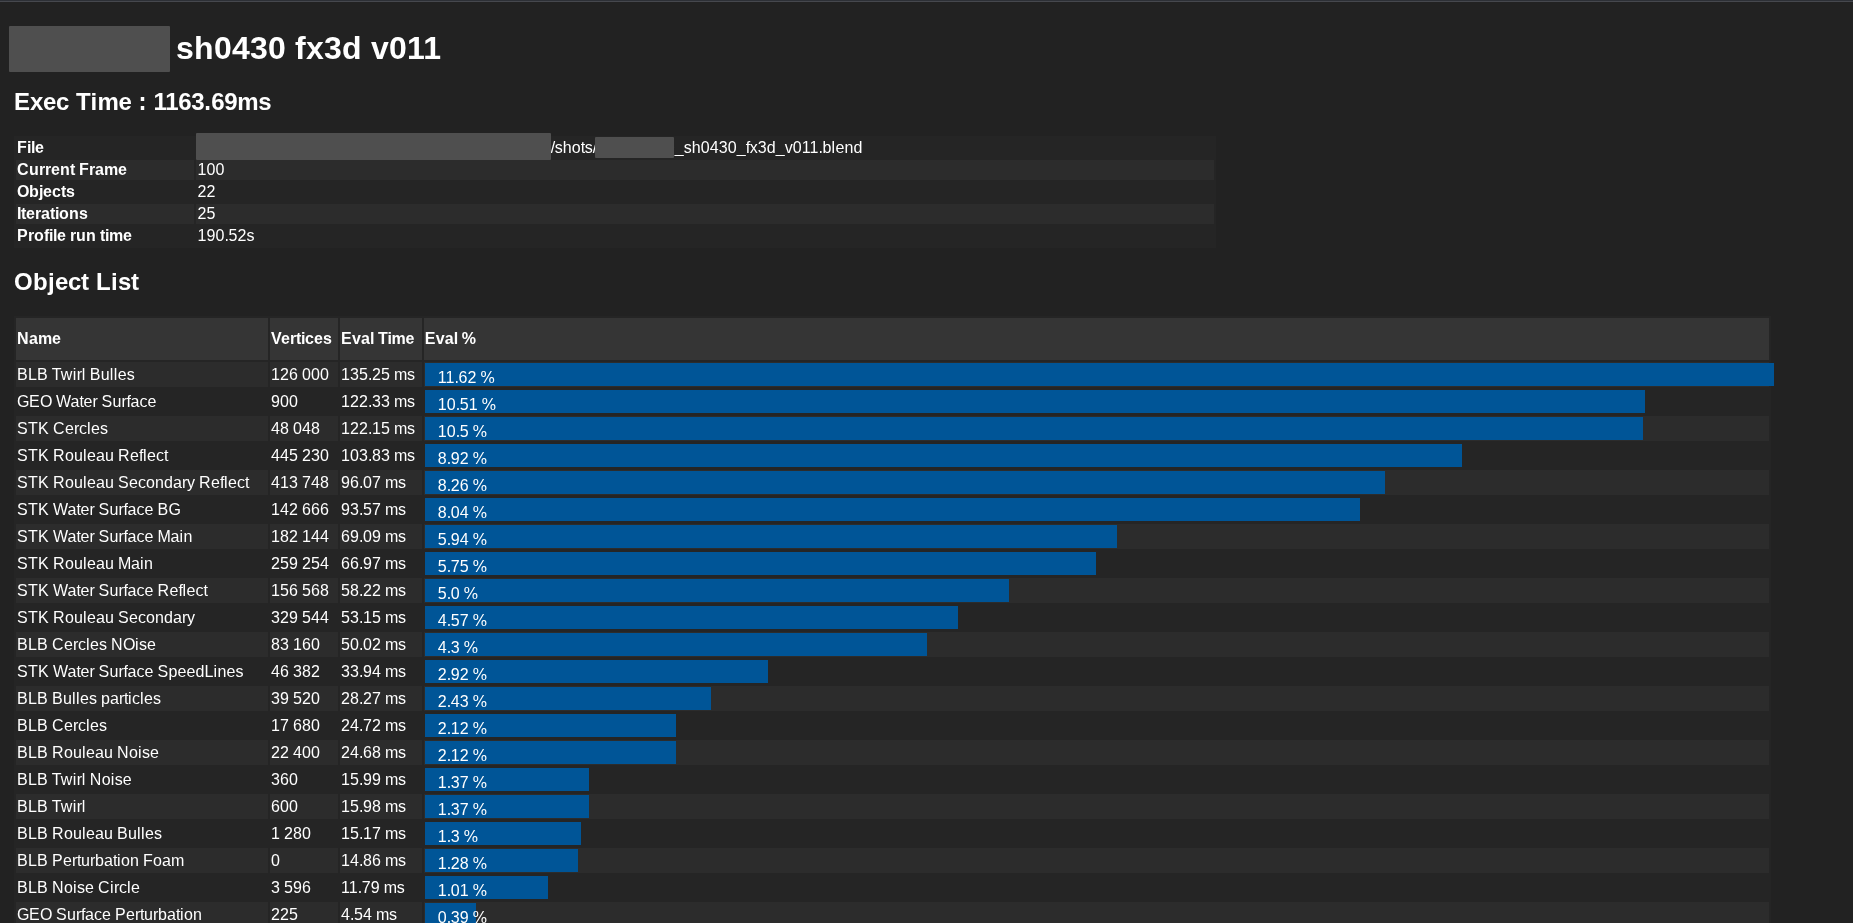
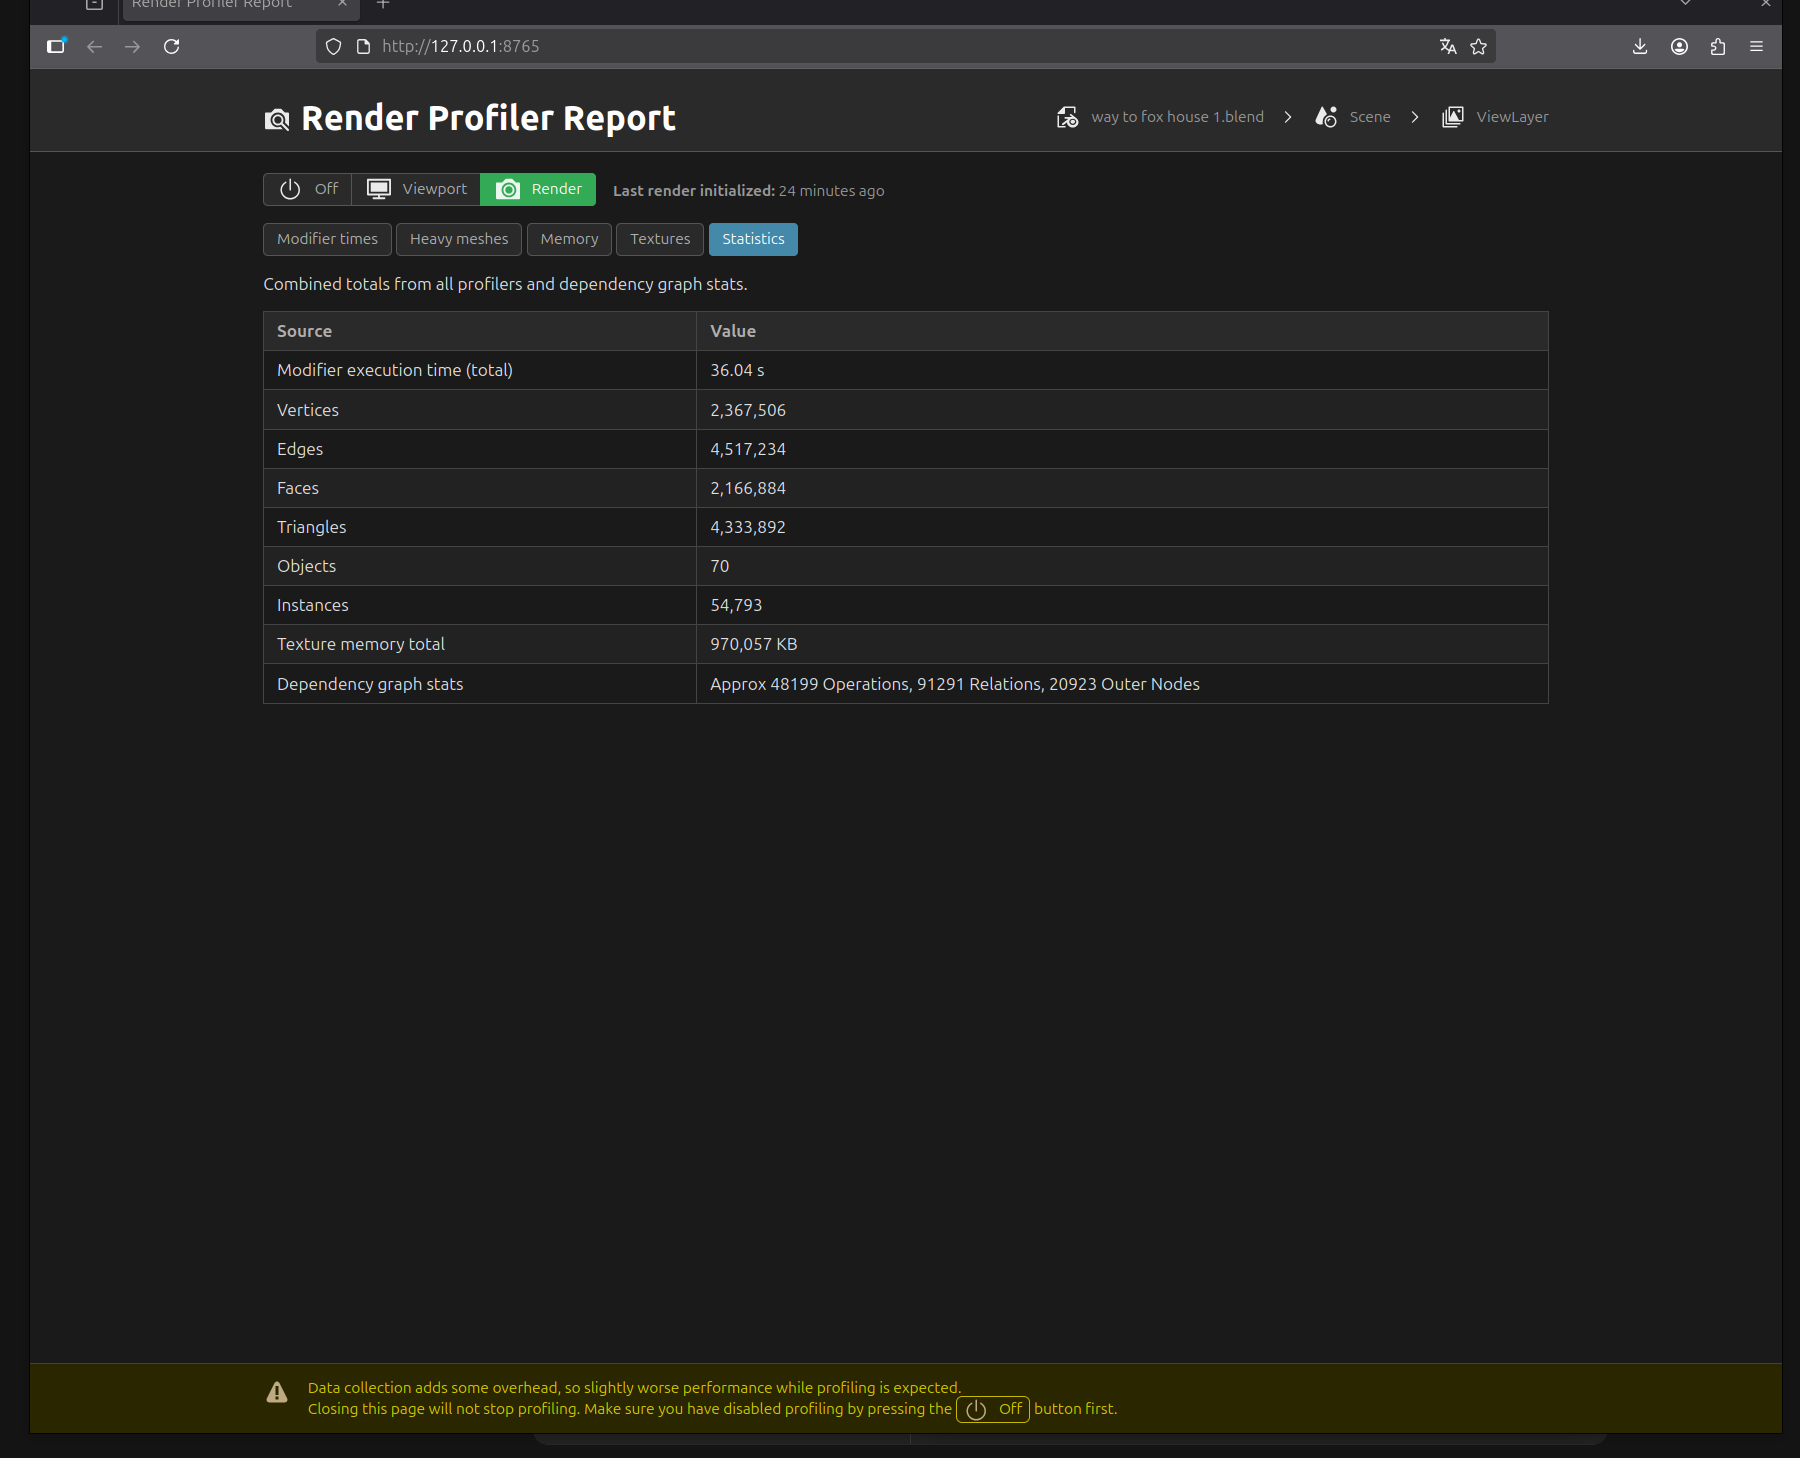
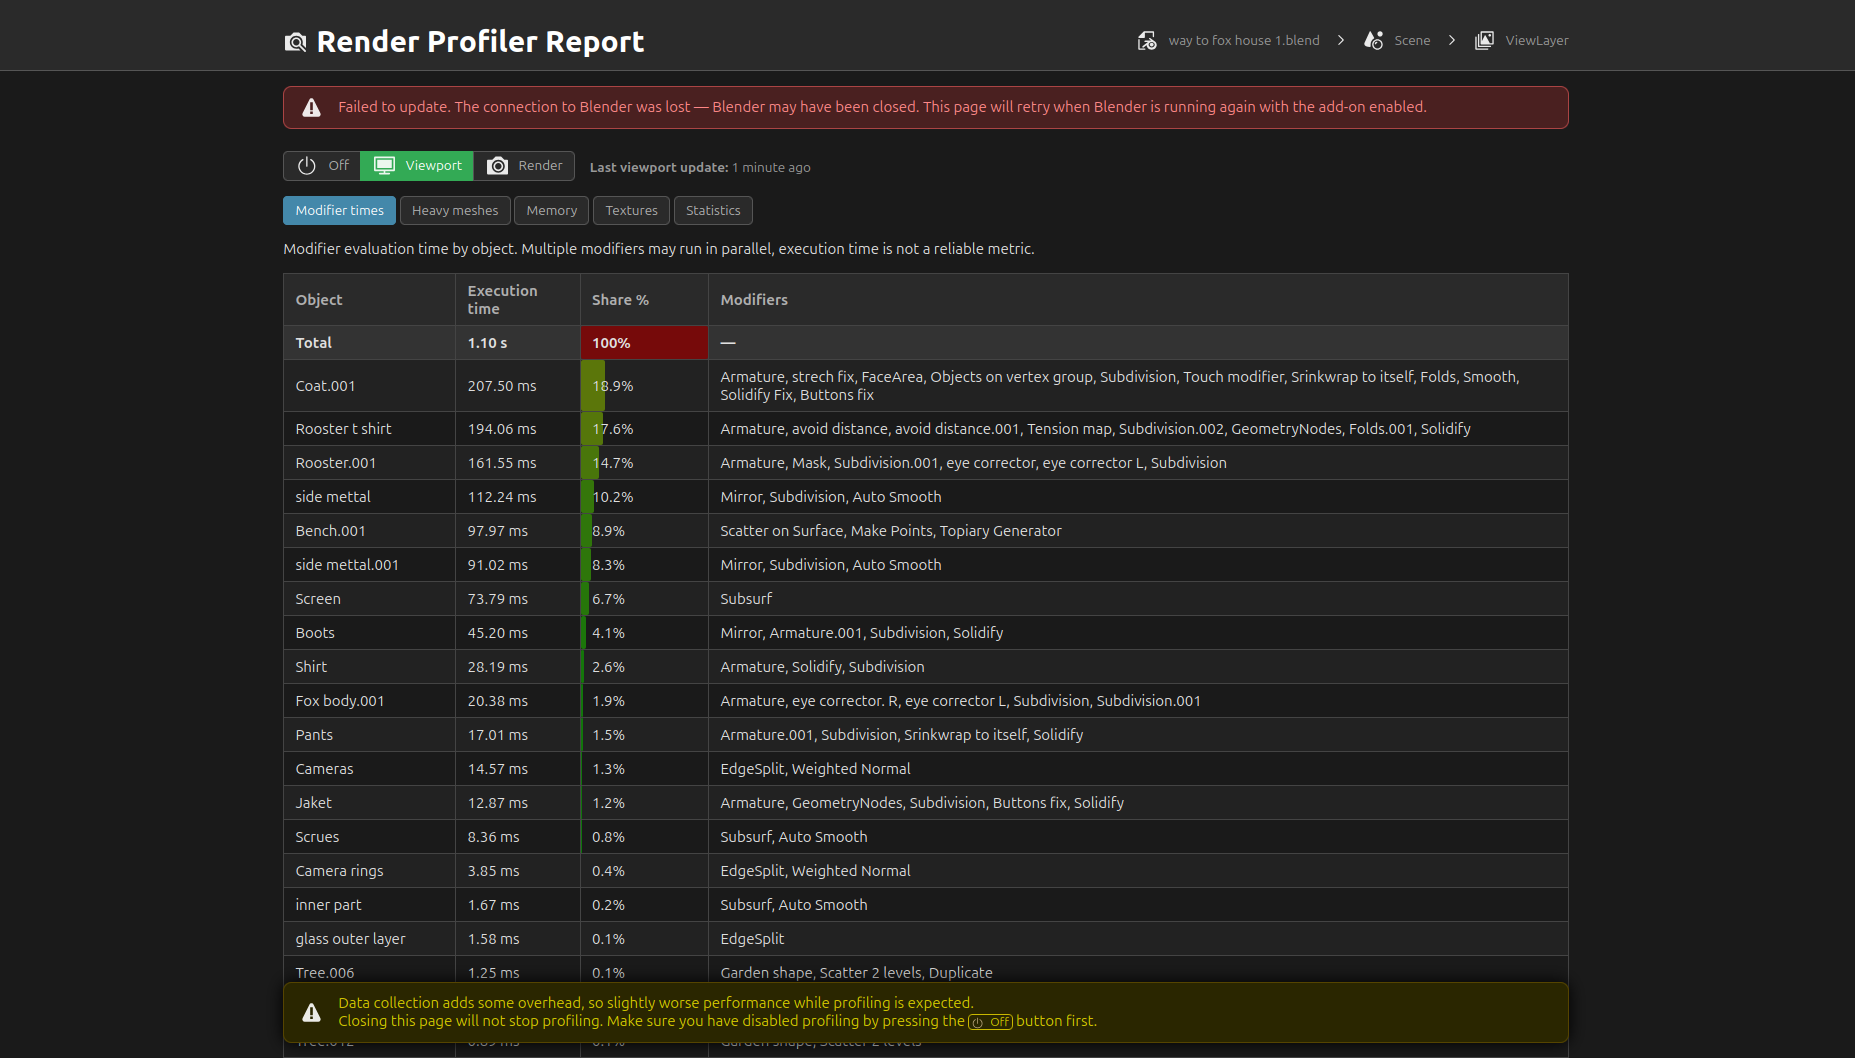
I’m working on an add-on that shows modifiers execution time, mesh sizes (vertex, poly counts), texture sizes and other useful statistics. As far as I know, it is the only solution that profile not only viewport, but render. Profiler opens as web page and keeps synced with Blender.
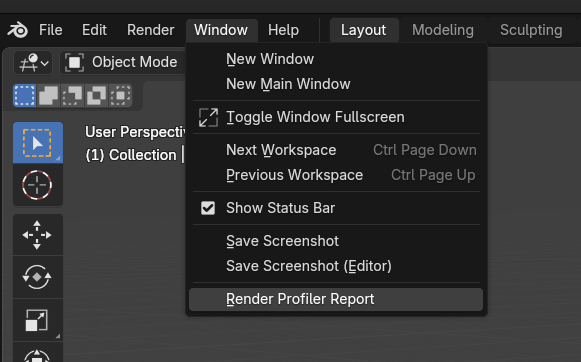
To open up profiler use Window → Render Profiler Report (or from F4 menu)
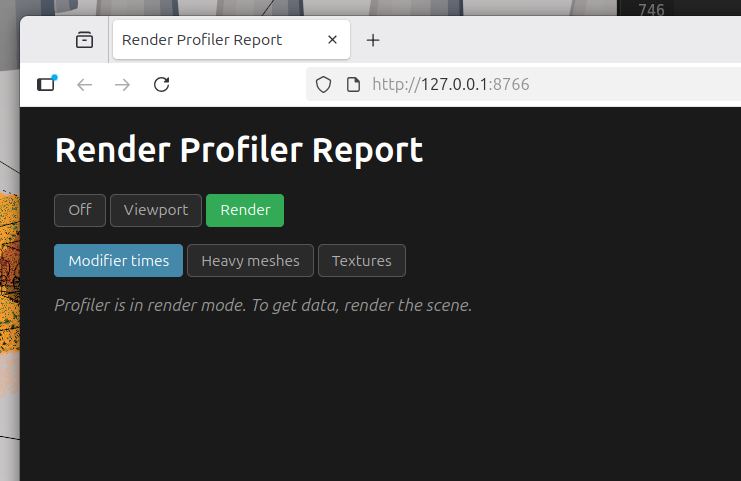
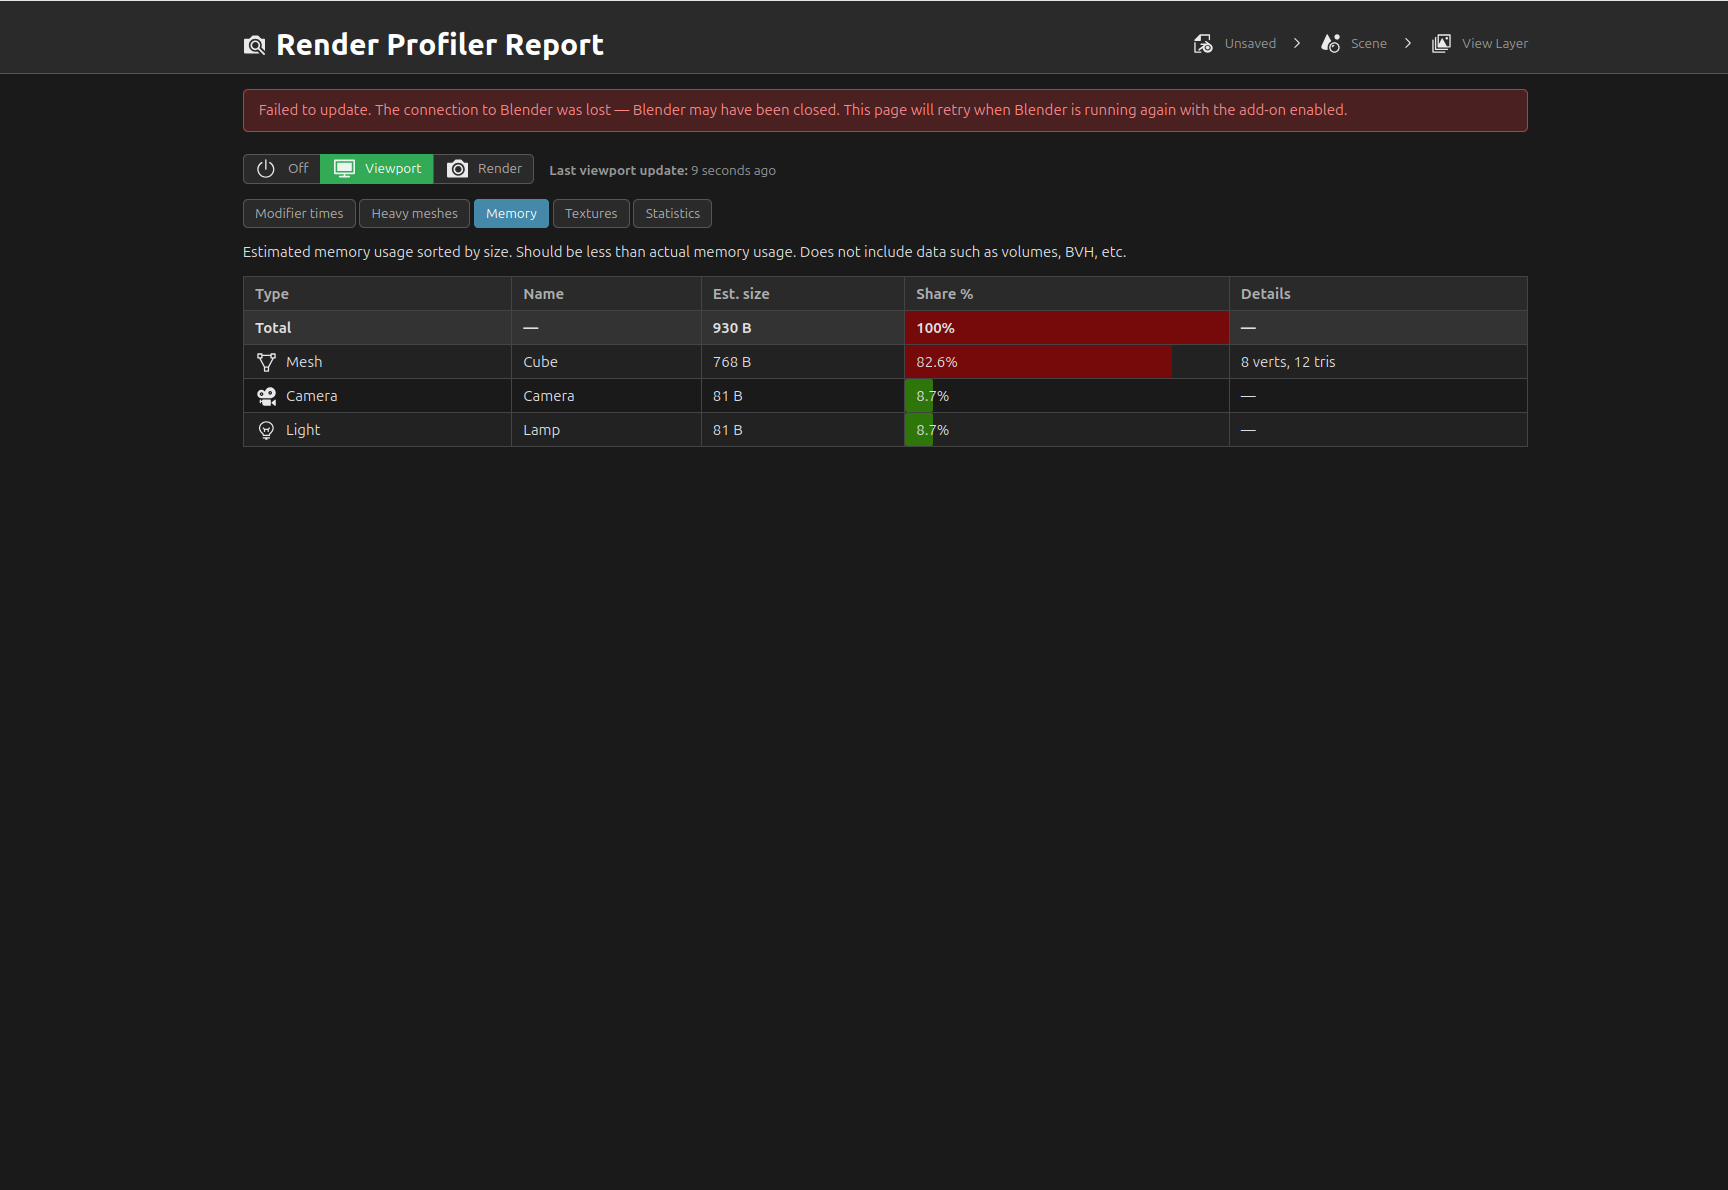
By default, it shows the data from viewport, but if you want, you can switch it to render mode, and follow the instructions. The system will wait render to get data from:
I’m doing a quick test.
As I have an heavy scene (+4M of polys), the first viewport analisys is long to complete. As I can understand that the addon has to analize the scene, in my opinion could be fine to have a popup with something like “Profiler Analizing” (or what you want) so the user is informed about what’s going on.
Another feature could be that, if this addon is enabled, it automatically opens the webpage with the info. Or, at least, set this feature as an option.
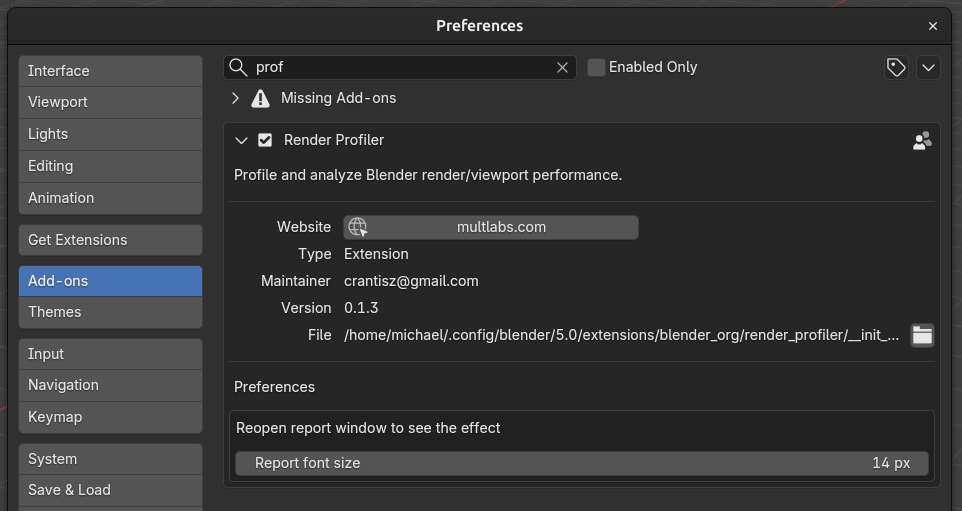
Another feature could be to set the font dimensions of the report webpage.
On FullHD resolution monitor, the font dimension could be reduced and the span of the table cells could be reduced.
Anyway, this reminds me this Vray tool
I don’t know if you’ll be able to go deeper with the analize…I hope yes.
I did a test.
Opened an heavy scene…made the viewport analisys and then the render one.
After, I’ve opened a small scene…the report doesn’t change the report.
I had to turn off the profiler and the reactivate viewport mode to get an updated report.
So, I have fixed the issue then reports disabled on loading scene. This is because window_manager props get reset on loading file, I supposed they stay the same even after loading a file.
What about first viewport analysis - this is because images are not preloaded in the scene. To get image size, they are loaded up in the memory, so that cold start may take some time. So if you set viewport into material preview, it should open fast. For now, I set them to load up only if mesh is evaluated, so that It will get image size only if they are in the list.
Actually, I don’t know if it is correct, images are not used if you are in solid mode, so whey should not be in a profiler?
Picked up Ideas about run browser before collecting data and font size
Anyway, pretty cool tool !
I’ve build something similar and this is very useful to optimize scenes and rig.
But it looks pretty rudimentary compared to what you’ve done !
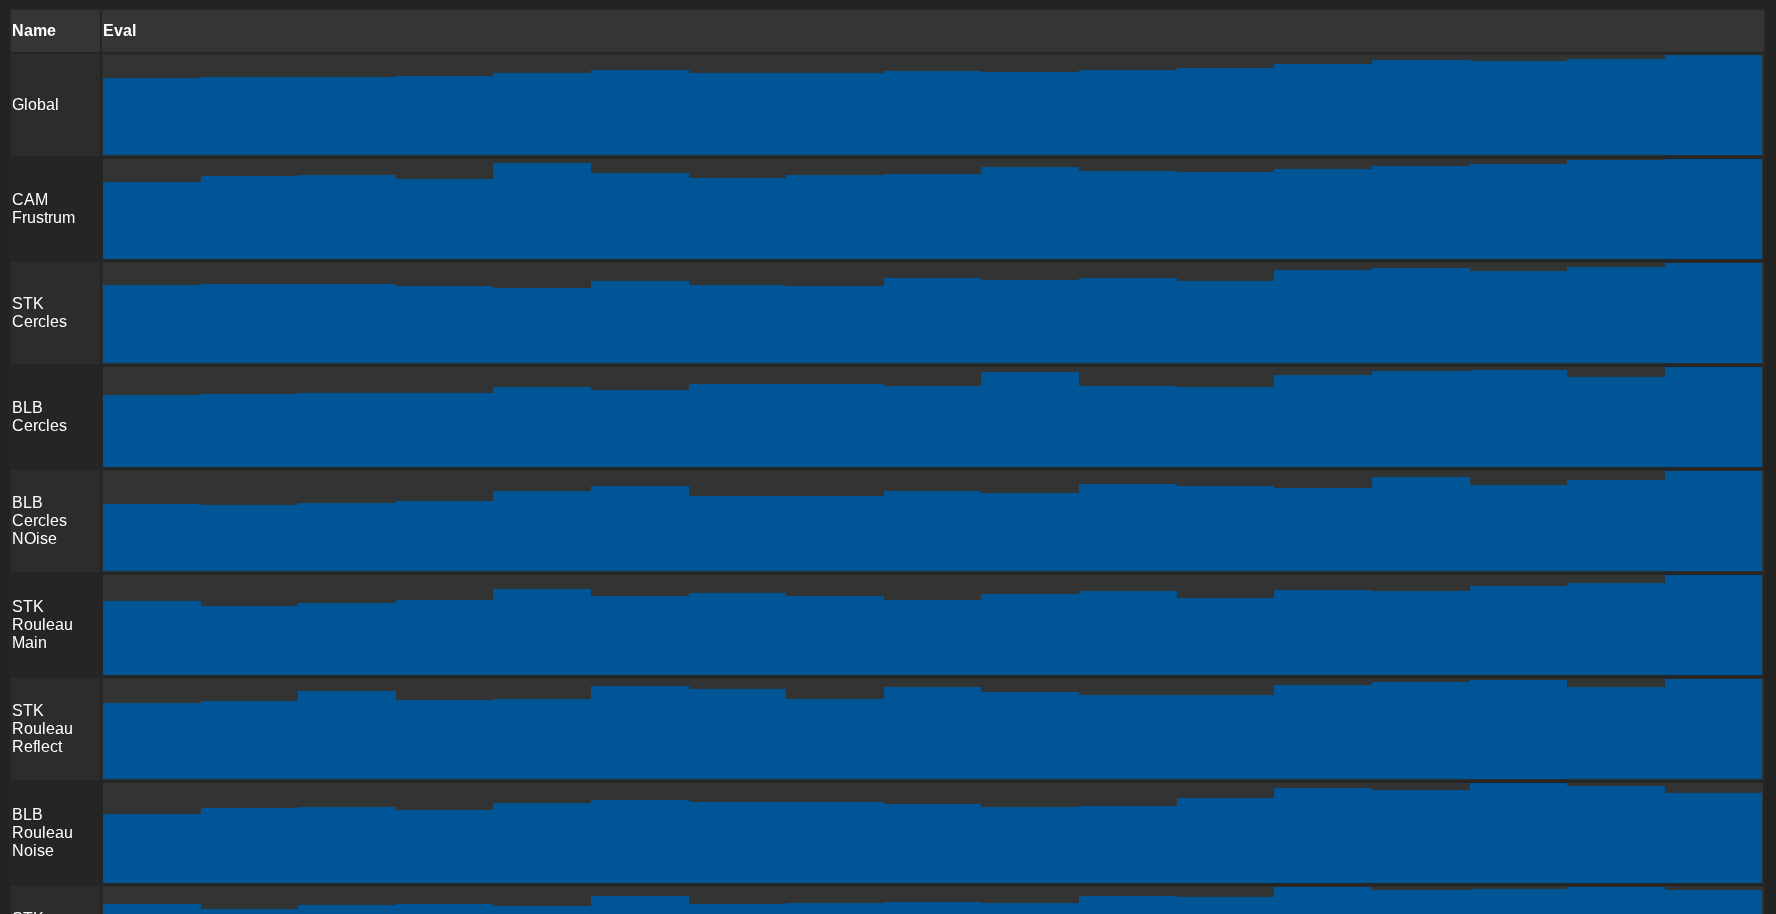
From what I read from the code the timings are cumulative right ? So you accumulate evaluation time to get a good mean value ? Which is pretty clever !
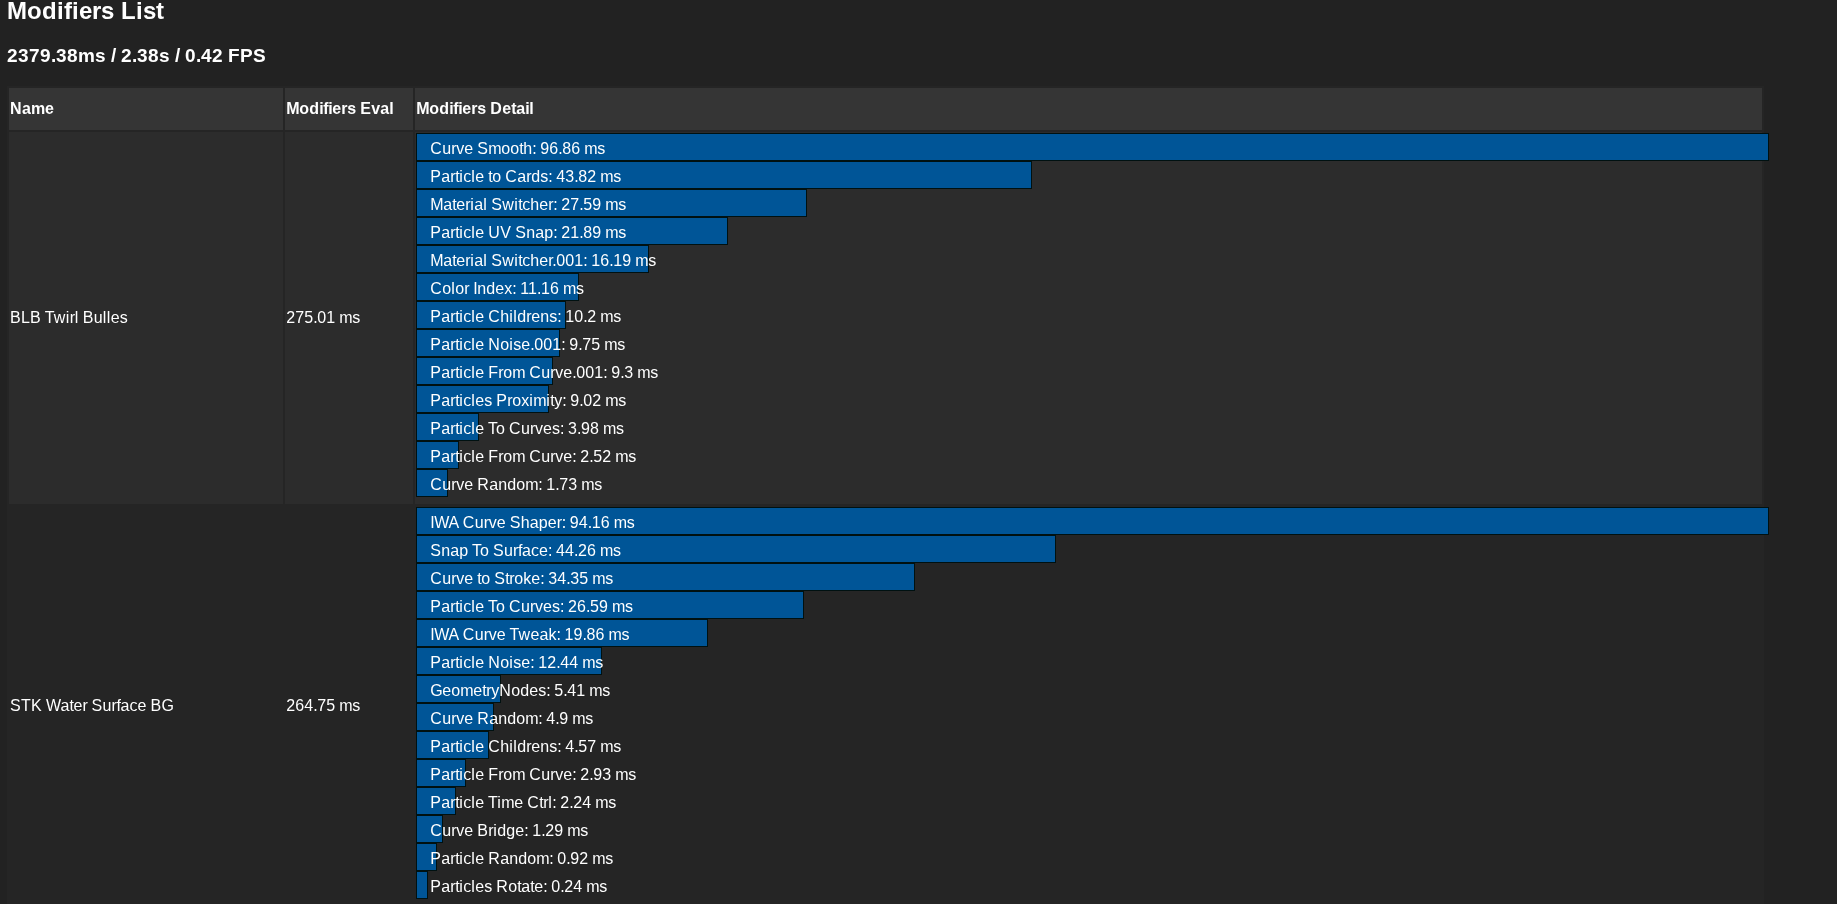
What I find helpful is to be able to have the list of each modifiers for each objects.
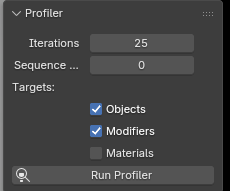
Here are some screen capture if you’re interested !
UI :
The material thing basically evaluates eevee materials by displaying them multiple time on screen. It’s not super reliable but it allows to identify slowdowns on complex scenes.
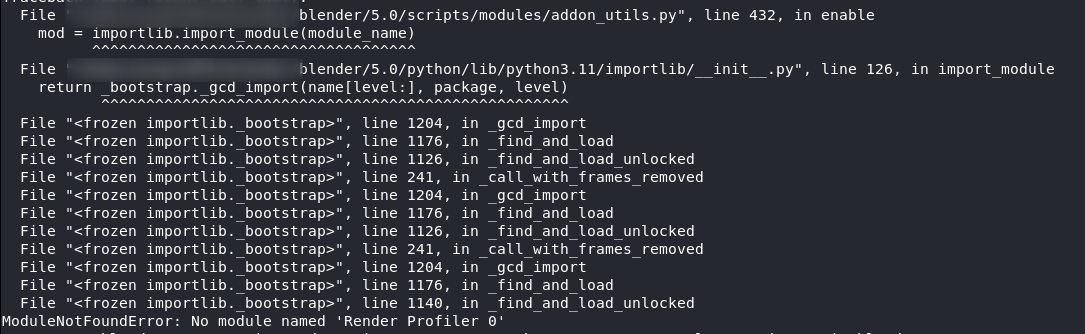
Strange error. Maybe an add-on with the same name? Try to remove previous version before installing the new one.
Timings are not cumulative. This line just sums times from all modifiers on the object:
execution_time_ms = sum(m.execution_time * 1000 for m in eval_obj.modifiers)
As I understand, you want to have time for each modifier.
For getting mean value. I haven’t seen this before. I used Unity’s profiles, and even it has a lot of useful things, there are no “mean versions” of displayed data. Looks like overkill for me
Ok ! I think the problem was that I copied the unzipped folder to my addons, it’s working now !
Well it probably depends on the use case : this is useful as execution time varies especially on fast geometry node graph. So if you want to know how a change is affecting performances, having a mean value is helpful. Sometimes you want to test only a few changes and see how they impact performances.
This is also how performance of nodes are measured when being developed, you run the calculation several times and get a mean value.
When doing optimizations you want to have reproducible values so running the profiler twice should give you similar results. If that’s not the case it can become confusing !
I’m experiencing that the viewport responsiveness get worst with your addon enabled (at the moment I’m on v.0.1.3) and with the webpage open on the browser.
Probably it’s due to an heavy scene I’m working on with many objects and tracing scene modifications add lags… what could be done? Could have sense to have a manual updating option? Something like “ok, now I want to profile my viewport (or render)” and I choose a menu option like “Render Profiler Report”?
Ok…I’ve tested and it works as expected…
Probably something that could be explained in the doc of the addon, if you’re planning to do.
Or (And) why not add a general advice in the webpage like “Tip: if you encounter additional viewport lags, consider to push “off” button to stop scene profiling”?
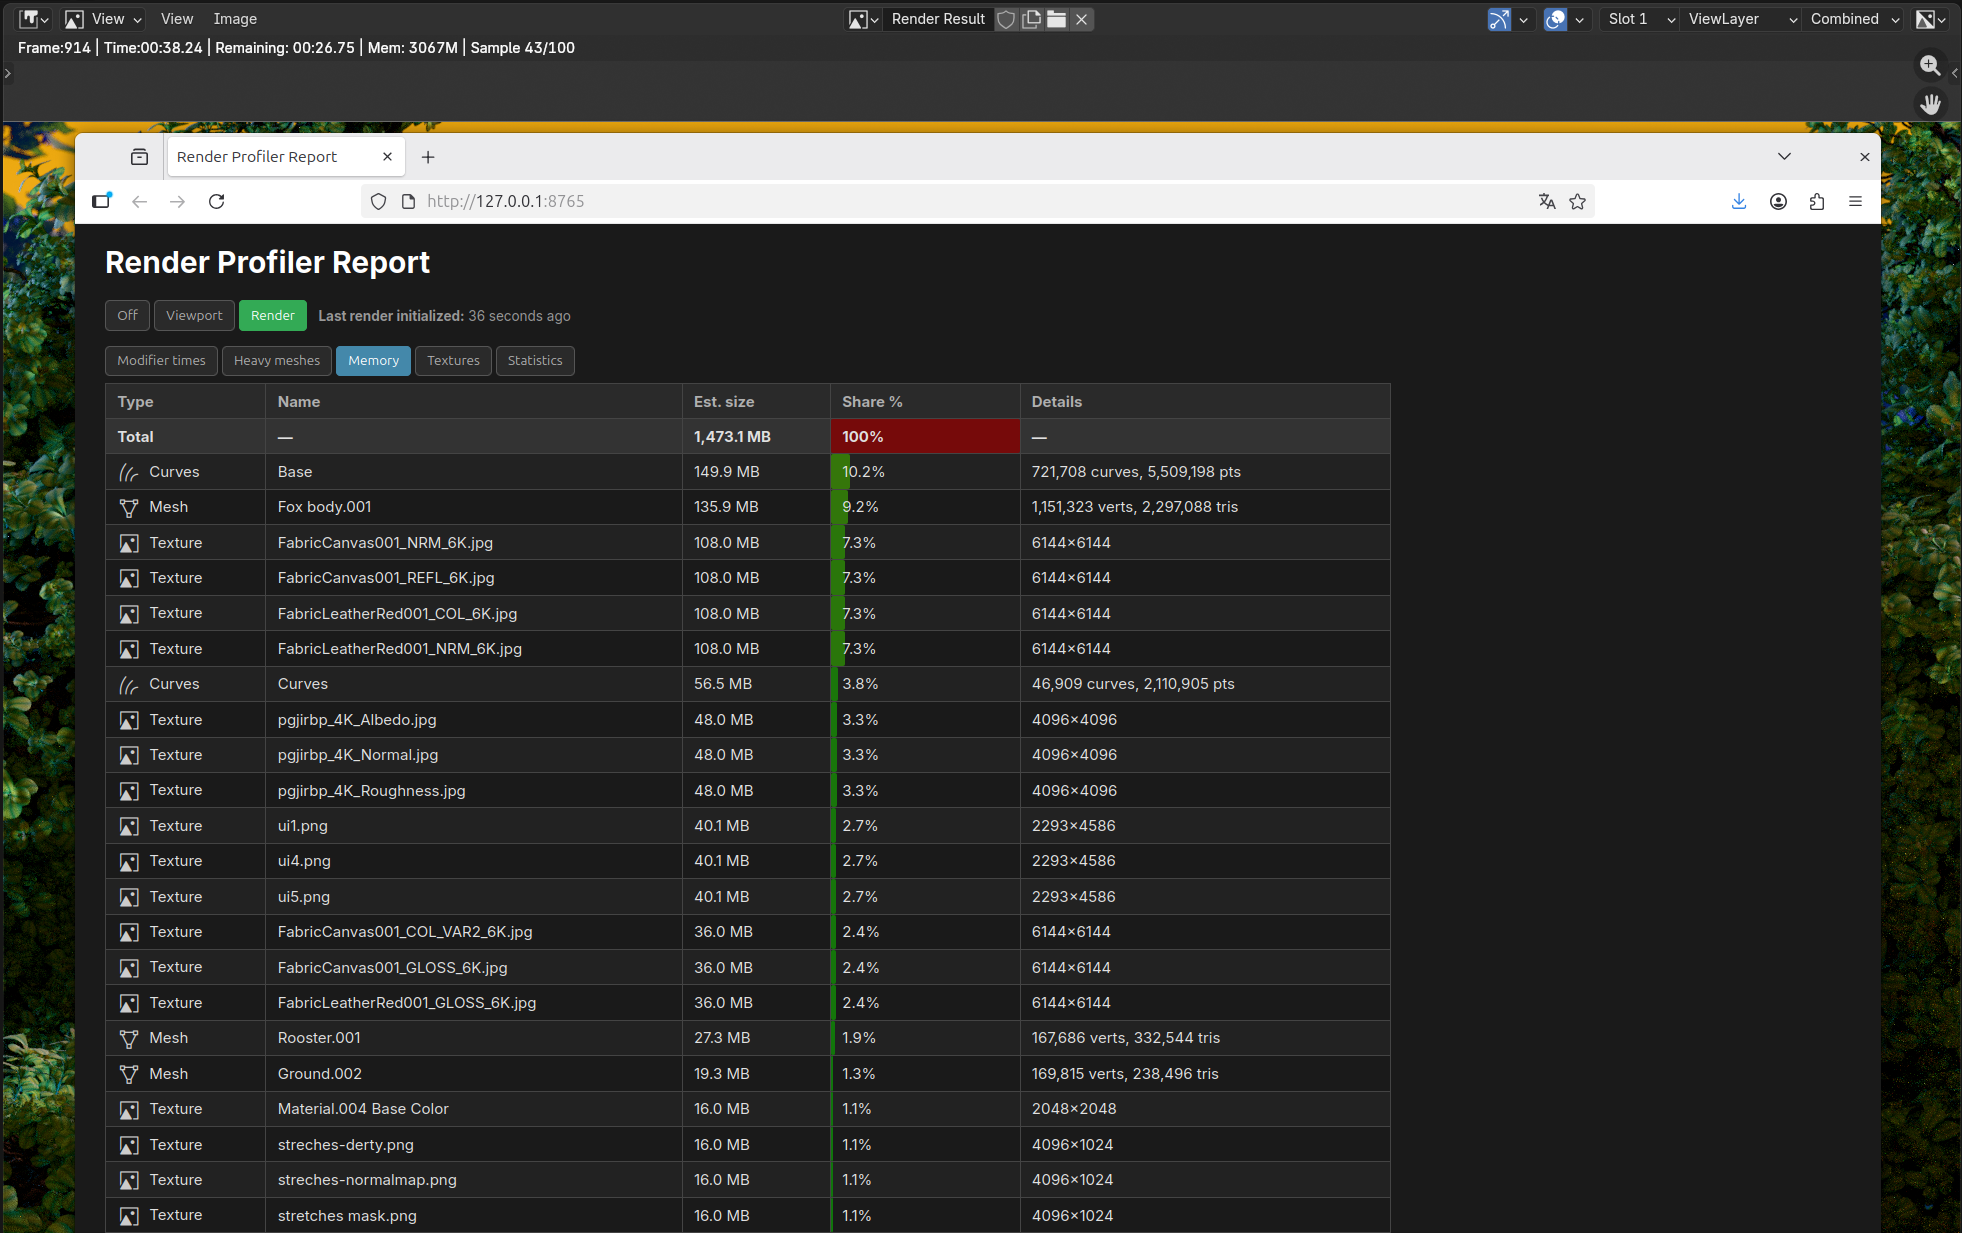
Edge: 2 ints = 8 bytes each.
Attributes (UV, vertex color, Geometry Nodes attributes) are added only when
used in at least one material node (UVMAP, ATTRIBUTE, or TEX_COORD).
Curves (hair / Geometry Nodes):
Per point: position (3 float) + radius (1 float) + normal (3 float) = 28 bytes.
Per curve: 4 bytes (offset in point array).
This does not include additional data, that is hard to calculate, like BVH
For the volume data - I can’t find the way to get volume data from Blender API.
I havent’ checked the lastest version but watching this preview I think it’s fine.
I’m still thinking that adding a permanent warning about the possible additional viewport lagging could be fine to have. Something not so big in the UI but visible that suggest to push the “Off” button in case of.
In any case…it’s not a big issue if you dont’ add it.
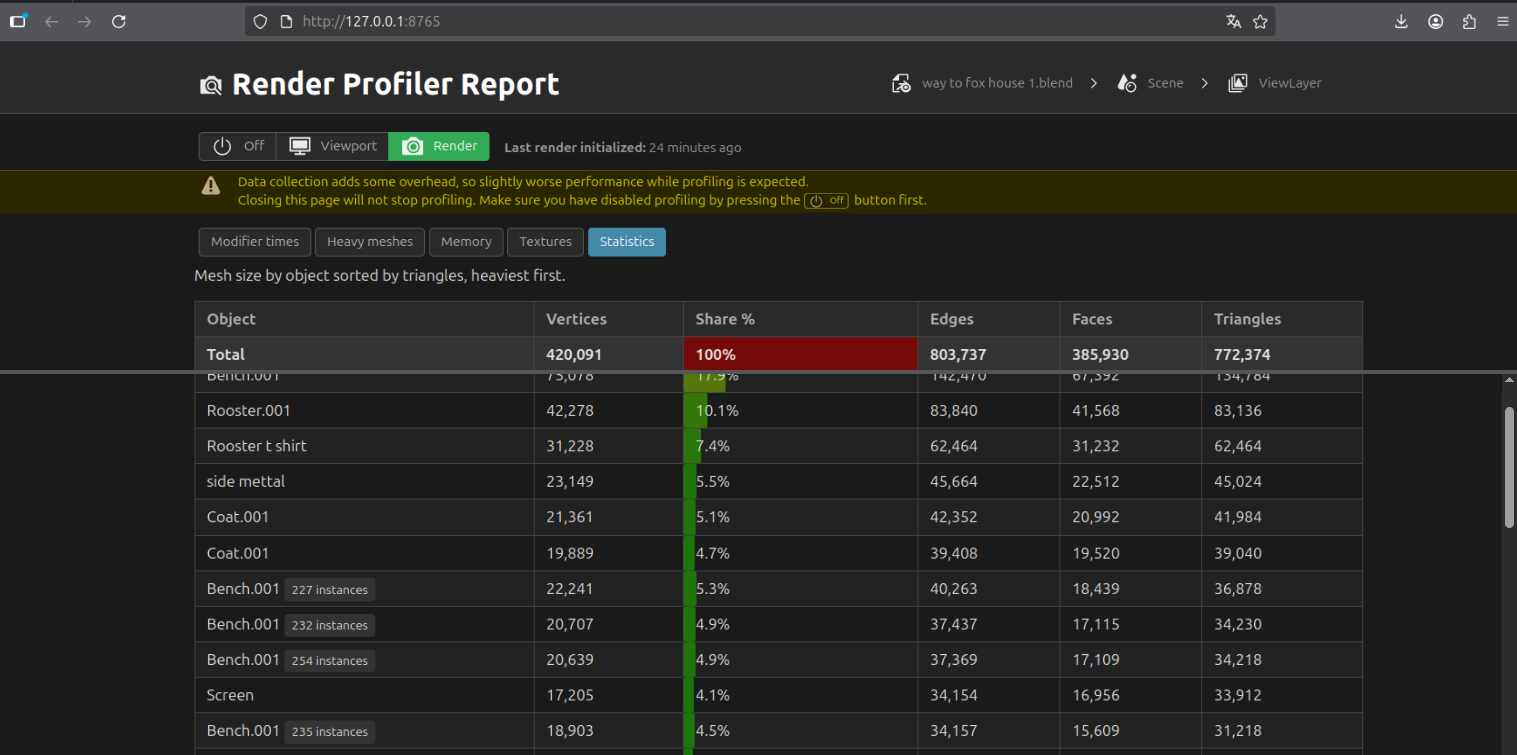
I’ve pushed the yellow warning on top (there could be an X button to close the it as you wrote), reduced the “Off” button icon to align to the text height and put the scroll just for the part of the table regarding the elements and kept fixed the first 2 rows as they don’t change.
I think this warning message should not be so active. It is important, especially if user closes the browser window and thinks that profile is disabled by that. I think where should be a button in Blender UI indicates the status. I am concerning about it at this point.
For the scrolling, maybe sticky headers can be useful here, but not the whole header.