Bad news, he hasn’t tried the 600s under Linux, for now it’s going to be broken, but once 2.8 is out some developer could take a look at it if he or she have access to a 620 on Linux
Thank you for looking deeper into this. It’s quite important to me, as I want to demo Blender at my studio, where our system OSes are out of date, thus won’t allow for any new builds… which is why I purchased a laptop, so I could bring the magic of Blender 2.8 + Eevee in. I’m still surprised by the number of professional 3D artists that are unaware of Blender’s recent developments…
… but I digress…
The fact that you are successfully able to use 2.8 with an Intel 620 graphics card under Windows gives me a little hope… now if I can only get it to work on the latest of Manjaro (18)… or even Ubuntu, which has the same issue.
Just downloaded today’s build and started testing again.
I tried switching to the OpenGL render mode in the Scene settings and the freezing still occurs. Is this what you mean (still getting used to the new render workflows)?
HOWEVER… something new discovered.
This is going to be a strange ride… so hold on. Please keep in mind that we’re talking about a laptop here, which is how/why I differentiate between zooming and tumbling the camera. A double-touch on the laptop touchpad allows me to zoom in and out, but I needed a middle-mouse button to discover the difference when tumbling).
SO…
If I switch to the Texture Paint workspace, it seems I can zoom in and out in the 3D View with no issues, though the issue started popping up when the mouse cursor hovers over the floating buttons on the left (i.e. the draw, blur, average, smear buttons). Again, I can zoom in and out with the 3D view in Texture Paint mode for quite a bit of time and cannot get it to freeze, but after about 10 seconds of moving the mouse around over the floating buttons… I get a complete 4-7 second freeze (feels like a total graphics system freeze).
In the same Texture Paint workspace, if I move the cursor over to the 2D “Paint” viewport on the left, I also experience no issues when zooming in and out of the 2D grid. BUT… the moment I start hovering the cursor over the left-side icon buttons (i.e. Draw, Soften, Smear, Clone, Fill, Mask), I experience the 5-7 second freeze again.
SOOoooo… let’s dig through the different 3D views (only loaded the default cube and Suzanne w/ no texture):
- Object Mode: Cannot zoom in and out for more than 2-4 seconds before experiencing the 4-7 second freeze.**
- Edit Mode: Like the Object Mode, I cannot zoom in and out without everything freezing.
- Vertex Paint: I can zoom in and out just fine, and will not experience the freeze unless I start hovering over the floating buttons or floating panels.
- Sculpt Mode: I can zoom in and out!
- Vertex Paint Mode: I can zoom in and out!
Next step was to plug in a mouse (here’s where it gets even stranger).
In any view, if I tumble the camera, I experience the freeze… !? The only thing I can guess is, if related to an overlay, the axis widget in the upper right corner is unaffected when I zoom in and out… but if I tumble, it does move. Perhaps this is an overlay update issue!? BUT… then you would assume that if I turned Overlays off… the problem would go away, but it does not.
In summary.
- If I zoom the camera in and out in Object and Edit mode, I get the 5-7 second freeze.
- If I zoom the camera in and out in any of the other 3D view modes (Sculpt, Vertex Paint, Weight Paint, and Texture Paint) I’m ok!
- If I tumble the camera, I get the freeze in any of the modes.
- If I hover the mouse over any of the floating buttons, I will get the freeze.
- If I’m in a workspace that does not have a 3D view or contain floating buttons (i.e. compositing or video sequence editing), all seems to be ok.
I hope this reaches the right people and helps resolve this. I’m guessing I’m not the only person out there with a 13" XPS laptop that wants to show off Blender 2.8.
BTW, I started questioning about this issue in the Manjaro (linux) forums, and although it’s a bit confusing (because my thread was hijacked), there are some more technical OS-related details on my issue.
I have to go back and test… but I don’t think I was experiencing issues when I tested this with the older Manjaro (Arch) 17.1 build… WITHOUT updates (updates brought the issue in). Again, this also happens with Ubuntu (Debian). Took me a bit to figure this out, so that adds to the confusion of the thread linked below… but here it is:
https://forum.manjaro.org/t/blender-2-8-stalling-freezing-when-manjaro-is-installed-on-laptop-but-not-when-via-livecd/64262/19
Thanks again for your help, and inspiration to dig deeper.
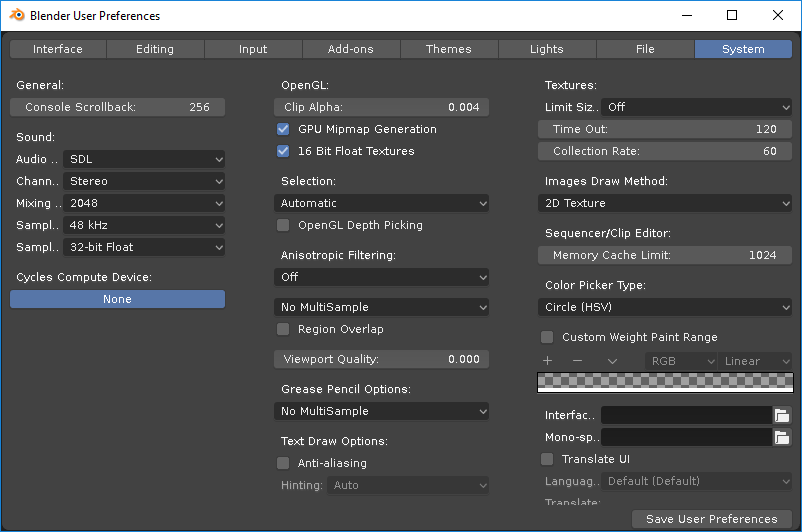
Hi @jerbot, I’m not sure I can help, but by your description, I suspect the problem has something to do with multisample, GL_POLYGON_SMOOTH or GL_LINE_SMOOTH.
Can you test the blender with these settings to see if anything changes?
(The best would be if Intel could pay some attention to these problems on their old GPUs).
Ah… but you see, you are helping by simply reading and responding. Let’s see if I can help you help me. 
I just set my Preferences to matched your setting exactly, though I have a new “OpenSubdiv compute” option below “Cycles Comput Device” (which is turned off).
After matching your settings, I noticed an immediate improvement, not only in the 3D viewport… but also finding the text much easier to read (noted for future).
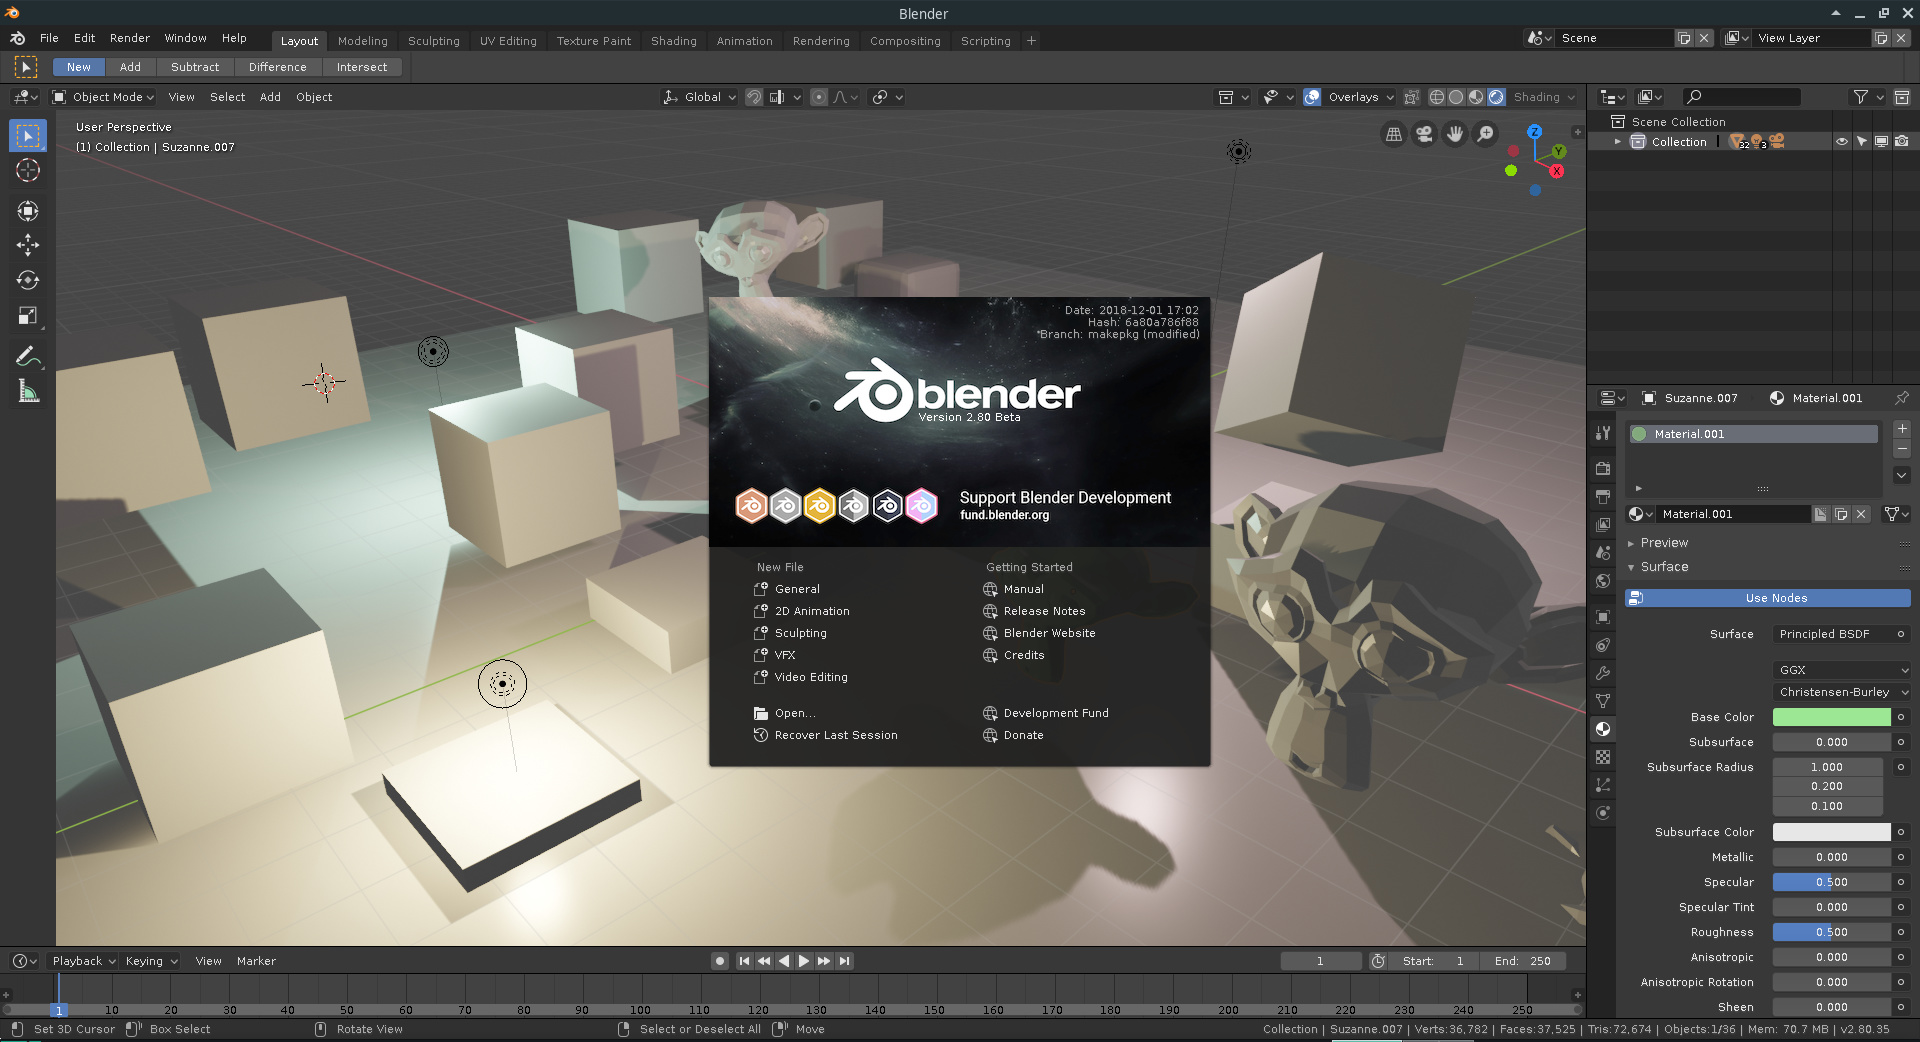
However, the moment I add another object, whether Suzanne or another cube, the freezing issue returns in force. The first time I tried adding Suzanne (monkey) to my scene it crashed… which gave me a crash-dump file. *attached
Or, if I select the default cube the problem occurs… and sticks around if I deselect (which leaves the object’s Origin point visible. At this point, if I turn off origins, things improve… but the problem does still exist… just less frequently (every 5-10 seconds, instead of every 2-3 seconds).
blender.crash.txt (1.1 KB)
Even improving a bit, it’s still hard to tell the cause. (to find out maybe the only way would be by donating a laptop with the same specifications for Clément).
Meanwhile you can try other things like:
- Run the blender with the “–debug-gpu” option to see more information on the console;
or… - In view3d press F3 to search the “Debug Menu” operator, type 23 in the menu that appears, confirm, zoom a few times and take a print of the screen.
Also make sure you have installed the latest driver -> https://downloadcenter.intel.com/product/96551/Intel-HD-Graphics-620
The simplest way to try new 2D and 3D drivers for intel in Linux, would be that you download some very new version of some distro not yet released, and you will try Blender 2.8 in Live mode. For example Ubuntu:
http://cdimage.ubuntu.com/daily-live/current/
I hear you and agree that would be the most effective way. If I was in Amsterdam, I’d be dropping my laptop off to Clément and buying him a meal/beer/coffee/tea for his time and effort. That being said, I cannot afford to purchase him a laptop. :\
I will give the --debug-gpu and Debug Menu options a try.
I think I have the latest open drivers as I have the latest Manjaro (Linux) build w/ updates (rolling release). From my understanding, most Windows users are not experiencing this particular issue.
Manjaro 18 (Arch Linux) user reporting back in with some interesting updates.
I was just visiting a friend who also has a 13" XPS laptop w/ Intel 620 graphics. He’s running KDE Neon, which uses an older kernel (forgot the exact version) and is having no noticeable issues (he only tested it while I was there). This lines up with my suspicions that something “broke” when the new kernels came out.
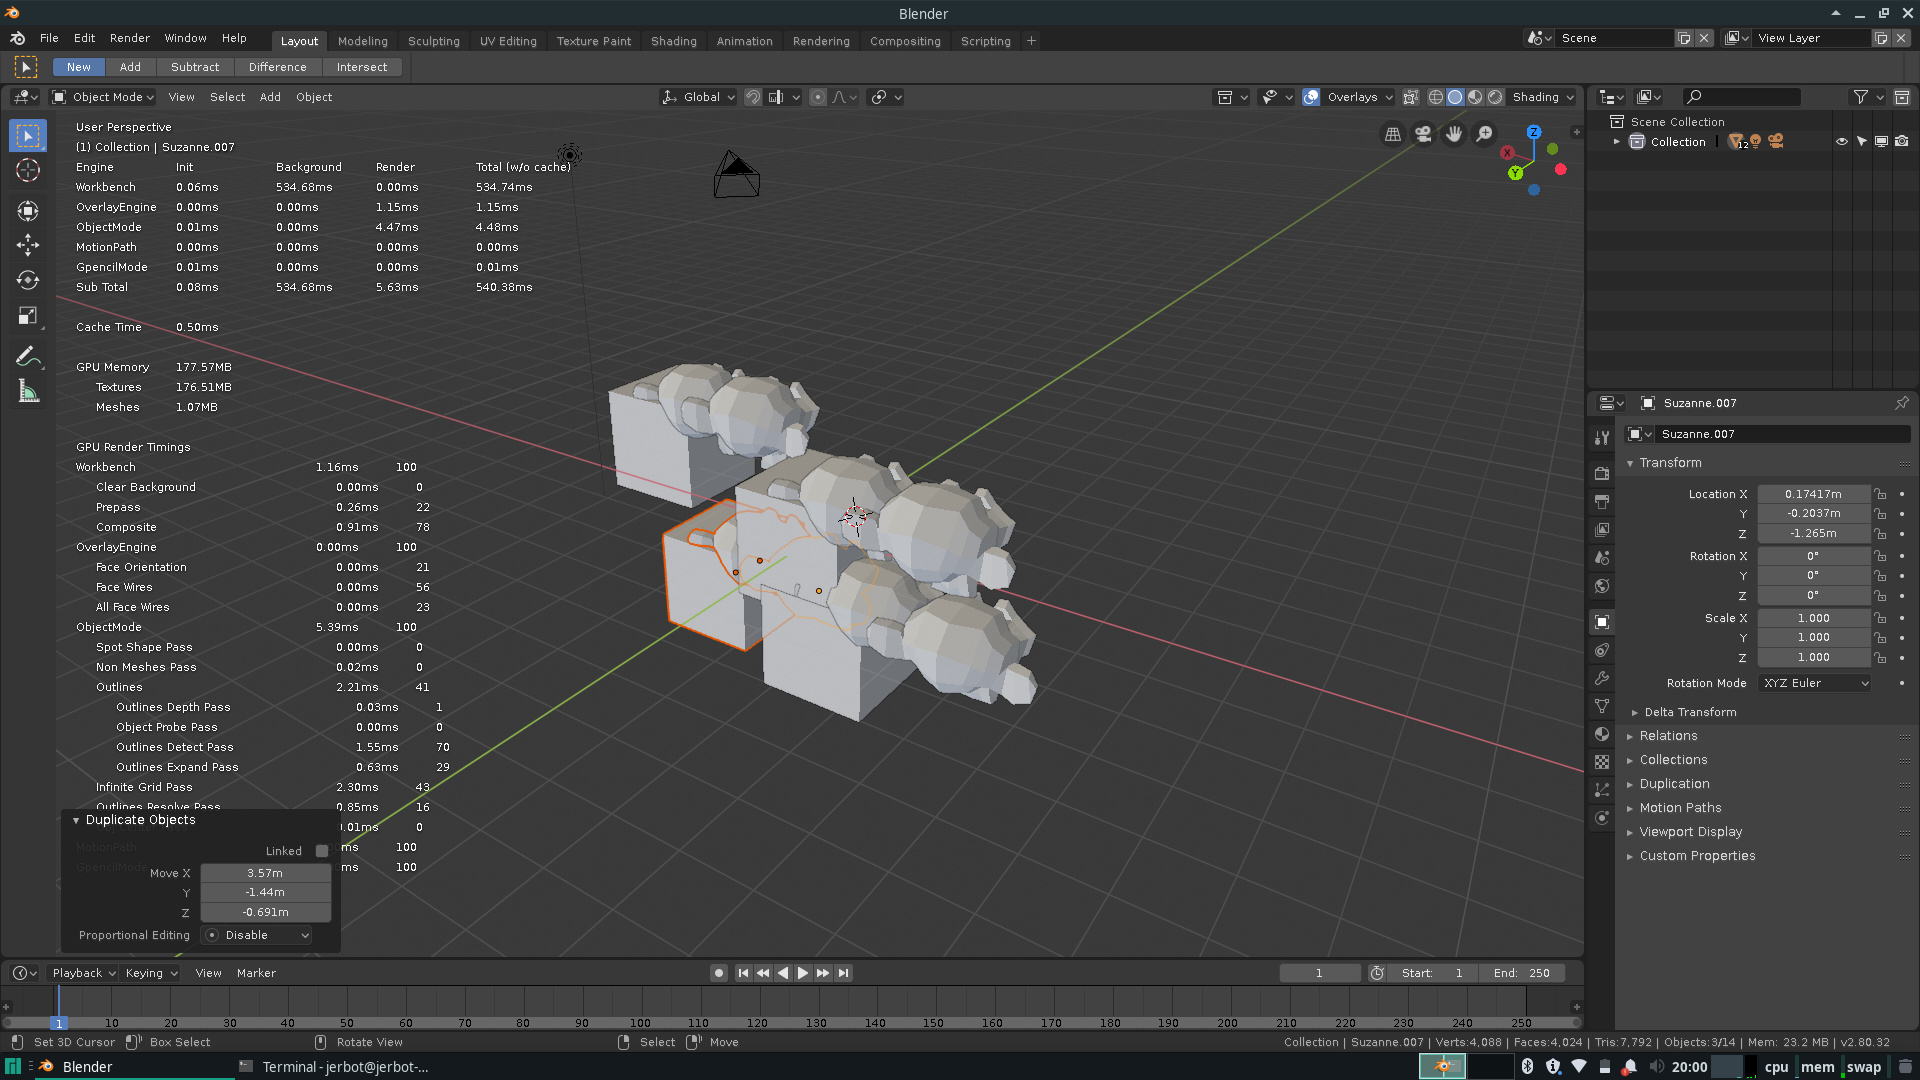
Attached is a screenshot of the debugger, set to 23.
And here is the output when running ./blender --debug-gpu
./blender --debug-gpu
Read prefs: /home/jer/.config/blender/2.80/config/userpref.blend
Using OpenGL 4.3 debug facilities
GL application marker: Successfully hooked OpenGL debug callback.
found bundled python: /home/jer/Downloads/blender-2.80-d891c8f1f80-linux-glibc224-x86_64/2.80/python
GL API performance: GTT mapping a busy "isl-miptree" BO stalled and took 0.958 ms.

GL API performance: GTT mapping a busy "isl-miptree" BO stalled and took 0.010 ms.

GL API performance: GTT mapping a busy "isl-miptree" BO stalled and took 0.036 ms.

GL API performance: GTT mapping a busy "isl-miptree" BO stalled and took 0.036 ms.

GL API performance: GTT mapping a busy "isl-miptree" BO stalled and took 0.048 ms.

GL API performance: GTT mapping a busy "isl-miptree" BO stalled and took 0.042 ms.

GL API performance: GTT mapping a busy "isl-miptree" BO stalled and took 0.060 ms.

GL API performance: GTT mapping a busy "isl-miptree" BO stalled and took 0.060 ms.

GL API performance: GTT mapping a busy "isl-miptree" BO stalled and took 0.060 ms.

GL API performance: GTT mapping a busy "isl-miptree" BO stalled and took 0.047 ms.

GL API performance: GTT mapping a busy "isl-miptree" BO stalled and took 0.047 ms.

GL API performance: GTT mapping a busy "isl-miptree" BO stalled and took 0.056 ms.

GL API performance: GTT mapping a busy "isl-miptree" BO stalled and took 0.037 ms.

GL API performance: GTT mapping a busy "isl-miptree" BO stalled and took 0.325 ms.

GL API performance: GTT mapping a busy "isl-miptree" BO stalled and took 0.057 ms.

GL API performance: GTT mapping a busy "isl-miptree" BO stalled and took 0.045 ms.

GL API performance: GTT mapping a busy "isl-miptree" BO stalled and took 0.205 ms.

GL API performance: GTT mapping a busy "isl-miptree" BO stalled and took 0.035 ms.

GL API performance: GTT mapping a busy "isl-miptree" BO stalled and took 0.034 ms.

GL API performance: GTT mapping a busy "isl-miptree" BO stalled and took 0.140 ms.

GL API performance: GTT mapping a busy "isl-miptree" BO stalled and took 0.035 ms.

GL API performance: GTT mapping a busy "isl-miptree" BO stalled and took 0.086 ms.

GL API performance: GTT mapping a busy "isl-miptree" BO stalled and took 0.163 ms.

GL API performance: GTT mapping a busy "isl-miptree" BO stalled and took 0.051 ms.

GL API performance: GTT mapping a busy "isl-miptree" BO stalled and took 0.054 ms.

GL API performance: GTT mapping a busy "isl-miptree" BO stalled and took 0.053 ms.

GL API performance: GTT mapping a busy "isl-miptree" BO stalled and took 0.298 ms.

GL API performance: GTT mapping a busy "isl-miptree" BO stalled and took 0.105 ms.

GL API performance: GTT mapping a busy "isl-miptree" BO stalled and took 0.109 ms.

GL API performance: GTT mapping a busy "isl-miptree" BO stalled and took 0.033 ms.

GL API performance: GTT mapping a busy "isl-miptree" BO stalled and took 0.035 ms.

GL API performance: GTT mapping a busy "isl-miptree" BO stalled and took 0.238 ms.

GL API performance: GTT mapping a busy "isl-miptree" BO stalled and took 0.314 ms.

GL shader compiler other: FS SIMD8 shader: 14 inst, 0 loops, 106 cycles, 0:0 spills:fills, Promoted 0 constants, compacted 224 to 144 bytes.
GL shader compiler other: FS SIMD16 shader: 14 inst, 0 loops, 118 cycles, 0:0 spills:fills, Promoted 0 constants, compacted 224 to 144 bytes.
GL API performance: CPU mapping a busy "isl-miptree" BO stalled and took 1.468 ms.

GL API performance: CPU mapping a busy "isl-miptree" BO stalled and took 0.012 ms.

GL API performance: CPU mapping a busy "isl-miptree" BO stalled and took 1.370 ms.

GL API performance: GTT mapping a busy "isl-miptree" BO stalled and took 0.458 ms.

GL API performance: GTT mapping a busy "isl-miptree" BO stalled and took 0.100 ms.

GL API performance: GTT mapping a busy "isl-miptree" BO stalled and took 0.058 ms.

GL API performance: GTT mapping a busy "isl-miptree" BO stalled and took 0.188 ms.

GL API performance: GTT mapping a busy "isl-miptree" BO stalled and took 0.158 ms.

GL API performance: GTT mapping a busy "isl-miptree" BO stalled and took 0.035 ms.

GL API performance: GTT mapping a busy "isl-miptree" BO stalled and took 0.040 ms.

GL API performance: GTT mapping a busy "isl-miptree" BO stalled and took 0.035 ms.

GL API performance: GTT mapping a busy "isl-miptree" BO stalled and took 0.037 ms.

GL API performance: GTT mapping a busy "isl-miptree" BO stalled and took 0.580 ms.

Skipping auto-save, modal operator running, retrying in ten seconds...
GL API performance: GTT mapping a busy "isl-miptree" BO stalled and took 0.335 ms.

GL API performance: GTT mapping a busy "isl-miptree" BO stalled and took 0.023 ms.

GL API performance: GTT mapping a busy "isl-miptree" BO stalled and took 0.405 ms.

GL API performance: GTT mapping a busy "isl-miptree" BO stalled and took 0.015 ms.

GL API performance: GTT mapping a busy "isl-miptree" BO stalled and took 0.432 ms.

GL API performance: GTT mapping a busy "isl-miptree" BO stalled and took 0.011 ms.

GL API performance: GTT mapping a busy "isl-miptree" BO stalled and took 0.016 ms.

GL API performance: GTT mapping a busy "isl-miptree" BO stalled and took 0.013 ms.

GL API performance: GTT mapping a busy "isl-miptree" BO stalled and took 0.013 ms.

GL API performance: GTT mapping a busy "isl-miptree" BO stalled and took 0.014 ms.

GL API performance: GTT mapping a busy "isl-miptree" BO stalled and took 0.274 ms.

GL API performance: GTT mapping a busy "isl-miptree" BO stalled and took 0.133 ms.

GL API performance: GTT mapping a busy "isl-miptree" BO stalled and took 0.011 ms.

GL API performance: GTT mapping a busy "isl-miptree" BO stalled and took 0.268 ms.

GL API performance: GTT mapping a busy "isl-miptree" BO stalled and took 0.312 ms.

GL API performance: GTT mapping a busy "isl-miptree" BO stalled and took 0.072 ms.

GL API performance: GTT mapping a busy "isl-miptree" BO stalled and took 0.023 ms.

GL API performance: GTT mapping a busy "isl-miptree" BO stalled and took 0.185 ms.

GL API performance: GTT mapping a busy "isl-miptree" BO stalled and took 0.050 ms.

GL API performance: GTT mapping a busy "isl-miptree" BO stalled and took 0.045 ms.

GL API performance: GTT mapping a busy "isl-miptree" BO stalled and took 0.330 ms.

GL API performance: GTT mapping a busy "isl-miptree" BO stalled and took 0.094 ms.

GL API performance: GTT mapping a busy "isl-miptree" BO stalled and took 0.298 ms.

GL API performance: GTT mapping a busy "isl-miptree" BO stalled and took 0.140 ms.

GL API performance: GTT mapping a busy "isl-miptree" BO stalled and took 0.148 ms.

GL API performance: GTT mapping a busy "isl-miptree" BO stalled and took 0.173 ms.

GL API performance: GTT mapping a busy "isl-miptree" BO stalled and took 0.185 ms.

Saved session recovery to '/tmp/quit.blend'

Blender quit
From the image we can really see a considerable slowness in the workbenck!
I surprised that isl-miptree in the prompt. Is blender really using the Intel driver? That sounds like 3D Mesa Graphics Library thing.
I don’t understand much how these mesa drivers work.
Could you check out the GPU that Blender is using on your laptot? To do this, simply go to the Help tab and select Save System Info (or search for this operator with F3).
The correct thing would be to appear something with the name “Intel” in “renderer:” (not Mesa).
OpenGL:
renderer: 'Mesa DRI Intel® HD Graphics 620 (Kaby Lake GT2) ’
vender: ‘Intel Open Source Technology Center’
version ‘4.5 (Core Profile) Mesa 18.2.5’
extensions:
It seems it’s common to use Mesa dirvers on Linux.
And the GL API performance: GTT mapping a busy 'message isl-miptree" ... message also is common in these drivers.
The mystery still remains ![]()
Mesa project is responsible for the development of Open Source 3D drivers for all graphics cards. Intel for Linux officially develops only Open Source drivers (2D and 3D), so Intel actively collaborates with Mesa project.
By the way, Clément Foucault (Main Eevee developer) uses Linux as the main platform for development as I understand it. I’m sure all the problems will be solved by Clément or Intel when 2.8 beta is released and problems reported (Blender or Intel).
Yeah, but Clèment don’t have access to Linux + Intel 620, that’s the problem
Hi there!
I have been working on the support of Intel Iris 620 on Linux systems. Currently we have found what might be he cause of the issue. If someone also compiles blender they might wanna check if this ‘disabling’ patch will make blender fast again.
http://pasteall.org/1396534/diff
Again, this is not the fix, but I wanna be sure that I have the same cause as you guys. So if some of you brave folks can compile blender using this patch and post the results here It will speed up the process.
Regards,
Jeroen
1 Like
Hello Jeroen!
It seems you have found a good reason for me to learn how to build Blender on Manjaro/Arch. Warning, I’m new at builds from scratch, though I just took a look online and I found an AUR from the wonderful Bartus!
AUR script for blender 2.8
https://aur.archlinux.org/packages/blender-2.8-git/
I’m foreseeing this taking me a bit of time to figure out how to edit the AUR package script(s) in order to insert your temp-fix modification…
SO, if there’s someone reading this that is a Arch Linux master… don’t wait for my slowness. Jump on it!
Again, thank you for looking into this issue, and for responding with a path towards a potential solution. If you have any tips for me as I walk through this AUR package install, and don’t mine doing a little hand-holding, I’m all yours.
OH! Jeroen! I just realized who you are. We met at Siggaph. BTW… I still wanna do those crowds of baby turtles. ![]()
For what it’s worth, I am on Pop!_OS 18.10 (based on Ubuntu 18.10) using a Dell XPS 13 9730 with UHD 620 graphics and experiencing the same issue. Output with the --debug-gpu flag:
wout@rossy:~$ Software/blender-2.80/blender --debug-gpu
Using OpenGL 4.3 debug facilities
GL application marker: Successfully hooked OpenGL debug callback.
found bundled python: /home/wout/Software/blender-2.80-0f5b53ba4dc-linux-glibc224-x86_64/2.80/python
GL API performance: GTT mapping a busy "isl-miptree" BO stalled and took 1.722 ms.
GL API performance: GTT mapping a busy "isl-miptree" BO stalled and took 0.068 ms.
GL API performance: GTT mapping a busy "isl-miptree" BO stalled and took 0.085 ms.
GL API performance: GTT mapping a busy "isl-miptree" BO stalled and took 0.091 ms.
GL API performance: GTT mapping a busy "isl-miptree" BO stalled and took 0.187 ms.
GL API performance: GTT mapping a busy "isl-miptree" BO stalled and took 0.109 ms.
GL API performance: GTT mapping a busy "isl-miptree" BO stalled and took 0.134 ms.
GL API performance: GTT mapping a busy "isl-miptree" BO stalled and took 0.111 ms.
GL API performance: GTT mapping a busy "isl-miptree" BO stalled and took 0.110 ms.
GL API performance: GTT mapping a busy "isl-miptree" BO stalled and took 0.107 ms.
GL API performance: GTT mapping a busy "isl-miptree" BO stalled and took 0.109 ms.
GL API performance: GTT mapping a busy "isl-miptree" BO stalled and took 0.130 ms.
GL API performance: GTT mapping a busy "isl-miptree" BO stalled and took 0.085 ms.
GL API performance: GTT mapping a busy "isl-miptree" BO stalled and took 0.551 ms.
GL API performance: GTT mapping a busy "isl-miptree" BO stalled and took 0.133 ms.
GL API performance: GTT mapping a busy "isl-miptree" BO stalled and took 0.575 ms.
GL API performance: GTT mapping a busy "isl-miptree" BO stalled and took 0.122 ms.
GL API performance: GTT mapping a busy "isl-miptree" BO stalled and took 0.234 ms.
GL API performance: GTT mapping a busy "isl-miptree" BO stalled and took 0.375 ms.
GL API performance: GTT mapping a busy "isl-miptree" BO stalled and took 0.125 ms.
GL API performance: GTT mapping a busy "isl-miptree" BO stalled and took 0.135 ms.
GL API performance: GTT mapping a busy "isl-miptree" BO stalled and took 0.101 ms.
GL API performance: GTT mapping a busy "isl-miptree" BO stalled and took 0.098 ms.
GL API performance: GTT mapping a busy "isl-miptree" BO stalled and took 0.100 ms.
GL API performance: GTT mapping a busy "isl-miptree" BO stalled and took 0.436 ms.
GL API performance: GTT mapping a busy "isl-miptree" BO stalled and took 0.222 ms.
GL API performance: GTT mapping a busy "isl-miptree" BO stalled and took 0.024 ms.
GL API performance: GTT mapping a busy "isl-miptree" BO stalled and took 0.025 ms.
GL API performance: GTT mapping a busy "isl-miptree" BO stalled and took 0.288 ms.
GL API performance: GTT mapping a busy "isl-miptree" BO stalled and took 0.498 ms.
GL API performance: GTT mapping a busy "isl-miptree" BO stalled and took 0.031 ms.
GL API performance: GTT mapping a busy "isl-miptree" BO stalled and took 0.120 ms.
GL shader compiler other: FS SIMD8 shader: 14 inst, 0 loops, 106 cycles, 0:0 spills:fills, Promoted 0 constants, compacted 224 to 144 bytes.
GL shader compiler other: FS SIMD16 shader: 14 inst, 0 loops, 118 cycles, 0:0 spills:fills, Promoted 0 constants, compacted 224 to 144 bytes.
GL API performance: GTT mapping a busy "isl-miptree" BO stalled and took 0.111 ms.
I also have a Dell XPS 15 9560 with HD 630 graphics and on the same distro I can confirm the same problem. Of course, on Nvidia everything is fine.
It’s bit of a bummer because I was really looking forward to adopting Blender 2.80. I hope they find a fix soon.
IT WORKS!!
Thank you Jeroen!! Oh my! Feels good to contribute a lil bit… and feels absolutely fantastic to have Blender 2.8 Beta working on my Dell XPS 13" laptop running the latest Manjaro (Arch) Linux ver 18 w/ all latest updates applied. As I mentioned… 2.8 was the reason I purchased this laptop… so I’m feeling very… WOO!!!
Is this the road towards getting this as a permanent update?
Ok, here’s some tips for anyone else who’s using a laptop with an Intel 620 graphics card (here’s a list of laptops BTW).
I first tested the AUR package from Bartus and Blender 2.8 BETA built just fine. I was able to run Blender and, as expected, the freezing issue was present.
With the successful dry run, it’s time to apply your modifications.
I applied your patch by using a tip from progandy, in this thread, where he says:
Simply execute a shell, e.g. “bash || return 1” as the first command in the build() function, do your editing and then “exit” when you are ready to build. If you want to abort the build, quit the shell with “exit 1”
progandy’s temporary interrupt in the build() function worked great. I used Yaourt to kick off the build, and when it dropped me to the command line, I found the source files in the /tmp/, and started the patching process.
I’m not sure how to use the patch command, but I made the edits to the screen_draw.c file manually. It was easy, as it was just commenting out the two blocks specified in your diff file.
Once the edits were saved, I entered exit into the waiting bash prompt and the build continued.
For people who cannot compile blender there is a not really workable workaround by switching the 3d editor to fullscreen area. In this mode the part that to our knowledge is blocking is then skipped.
Still looking for a good solution. Ps there is now an official bug report for people who want to contribute https://developer.blender.org/T57455
1 Like
Contributed my experience with Manjaro 18 to the bug report. Thx again!